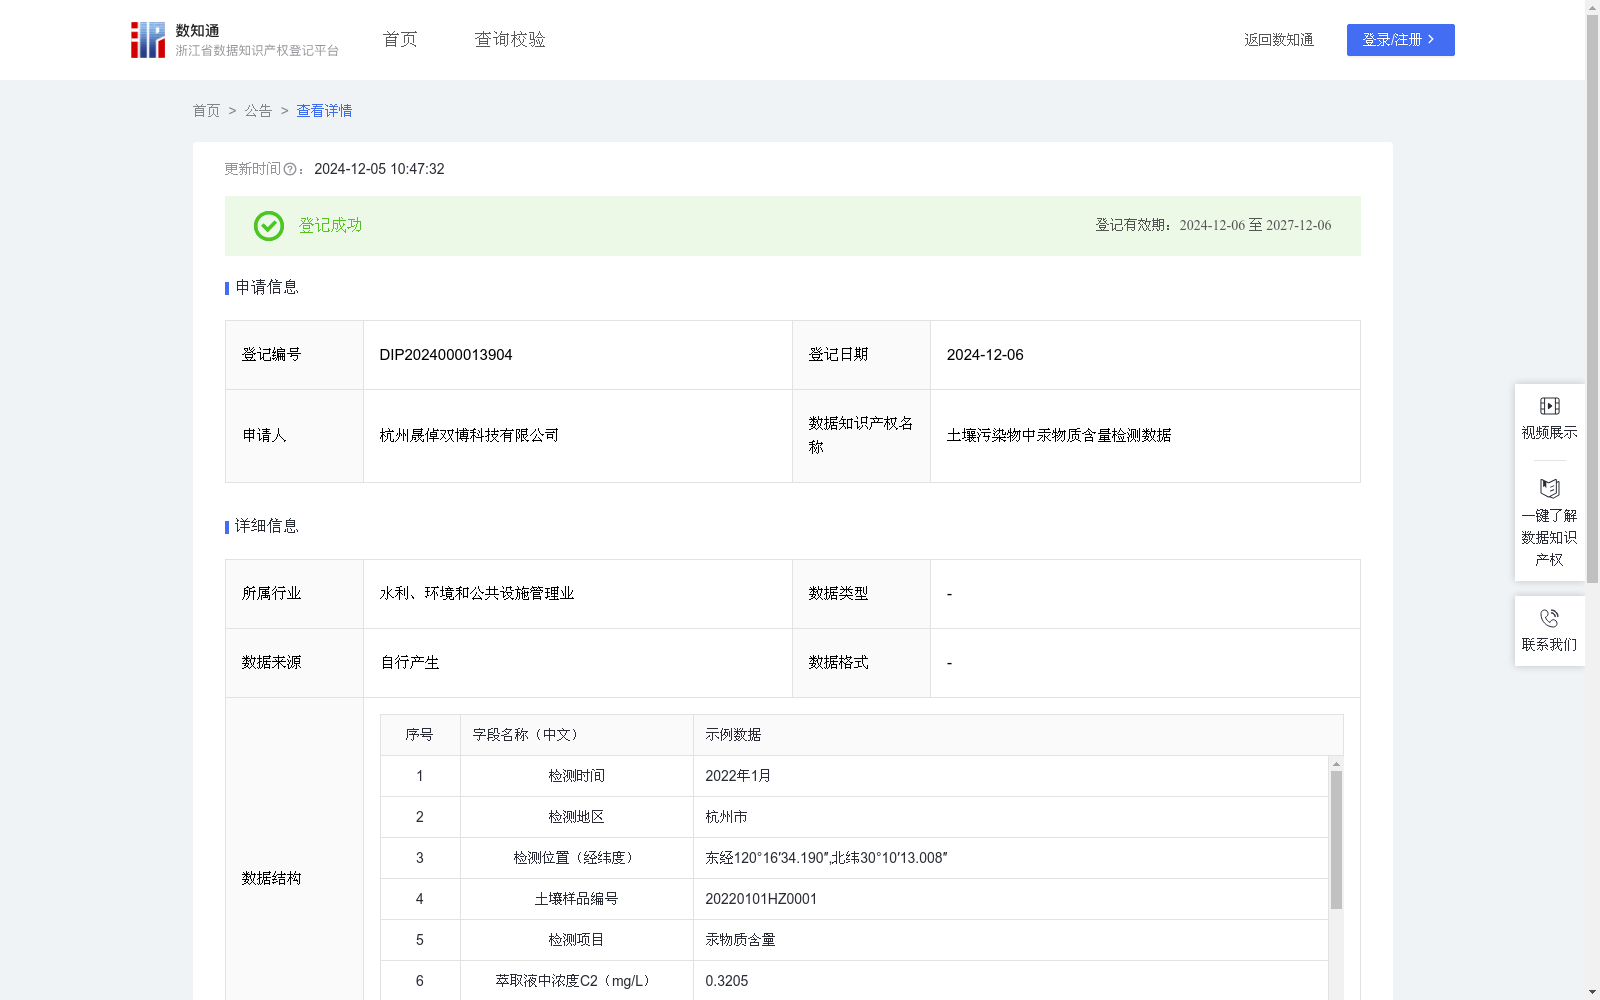
土壤污染物中汞物质含量检测数据
收藏浙江省数据知识产权登记平台2024-12-05 更新2024-12-06 收录
下载链接:
https://www.zjip.org.cn/home/announce/trends/96615
下载链接
链接失效反馈官方服务:
资源简介:
通过检测数据分析研判,我们可以判断土壤污染物中汞物质是否超标,避免因汞物质持续污染而产生的污染问题,有以下几点作用。一、进行土壤污染治理可以减少农作物中的该有害物质含量,确保食品的质量和安全;二、根据检测结果可有针对的改善士壤质量,提高土壤的生产力,可以为农业发展提供可持续的基础,同时也有利于保护和改善环境。另外可结合地理信息系统(GIS)技术,将各地点的土壤地理数据和污染物含量信息进行深度整合和分析,绘制位置-污染物含量地图,以直观的可视化形式呈现给用户,增强地理位置与污染物含量关系的理解,构建起一个包含污染源、污染物种类、污染程度、污染扩散路径等多维度信息的地理图谱。这一图谱不仅能够提供实时的监测数据,还能够通过数据之间的关联性,揭示潜在的污染风险和趋势。数据采集:对各地区不同地点进行土壤采集,不同地点采集的土壤按样品编号进行划分,对采集的土壤污染物中汞物质进行含量检测。数据判定:按X= C2* V0*D/ Vw 公式中X为土壤污染物中汞物质含量,式中C2为萃取液中浓度;V0为萃取液体积,D为稀释倍数,Vw为取样量。若汞物质实测值不大于0.5mg/L,则该土壤污染物中汞物质含量为合格,否则为不合格。另外当月汞物质含量与上月历史含量相比,污染程度可评为加重、减轻和持平。
By analyzing and evaluating test data, we can determine whether mercury contaminants in soil exceed regulatory limits, thereby preventing pollution problems arising from sustained mercury contamination. This approach offers the following benefits:
1. Implementing soil pollution remediation can reduce the levels of this harmful mercury substance in crops, ensuring food quality and safety;
2. Targeted improvements to soil quality can be made based on test results, enhancing soil productivity and providing a sustainable foundation for agricultural development, while also contributing to environmental protection and improvement.
Additionally, by integrating Geographic Information System (GIS) technology, we can conduct in-depth integration and analysis of soil geographic data and contaminant concentration information from various locations, and create location-contaminant concentration maps. These maps are presented to users in an intuitive visual format, enhancing understanding of the relationship between geographic location and contaminant levels, and establishing a geospatial knowledge graph that includes multi-dimensional information such as pollution sources, contaminant types, pollution severity, and pollution diffusion paths. This geospatial knowledge graph not only provides real-time monitoring data, but also reveals potential pollution risks and trends through the correlation between different datasets.
### Data Collection
Soil samples are collected from various locations across different regions, and samples from different locations are categorized by sample IDs. The mercury contaminant concentration in the collected soil samples is then tested.
### Data Determination
The formula X = C2 * V0 * D / Vw is used, where X represents the mercury contaminant concentration in soil, C2 is the concentration in the extract, V0 is the volume of the extract, D is the dilution factor, and Vw is the sample volume. If the measured mercury concentration is no greater than 0.5 mg/L, the mercury contaminant content in the soil sample is deemed qualified; otherwise, it is deemed unqualified. Additionally, when comparing the current month's mercury contaminant levels with the historical levels from the previous month, the pollution severity can be classified as worsening, alleviating, or remaining unchanged.
提供机构:
杭州晟倬双博科技有限公司
创建时间:
2024-10-29
搜集汇总
数据集介绍
特点
该数据集记录了土壤污染物中汞物质含量的检测数据,包含7536条记录,每月更新。数据涵盖检测时间、地点、样品编号、汞含量等详细信息,用于评估土壤污染状况并支持环境治理和农业发展。
以上内容由遇见数据集搜集并总结生成


