普通住宅用电分析数据
收藏资源简介:
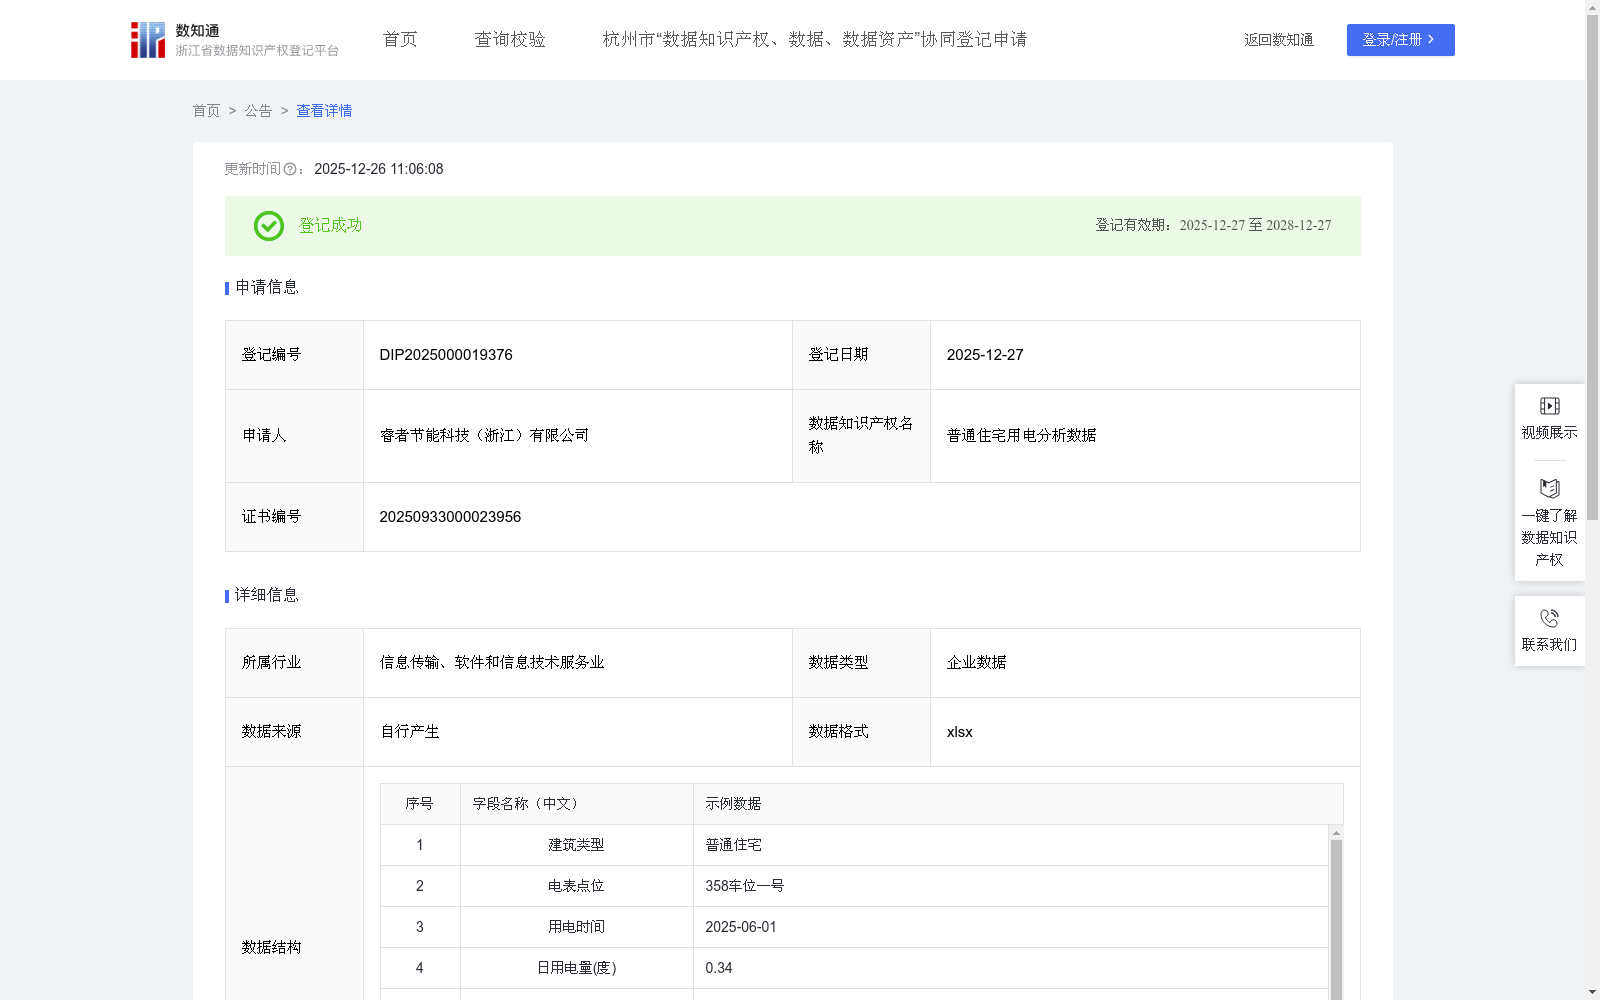
普通住宅用电分析数据的应用场景是普通住宅用电智能监测与管理。通过分析普通住宅各个资源点位的用电数据,包括月用电量、月每日用电量均值、标准差、变异系数及当月增长率等,实现了对各处电量使用情况的精准把握,为普通住宅管理人员优化能源管理、排查异常能源消耗提供决策支持。此外,其他普通住宅可借鉴本分析数据完善自身对于电量使用的监测与管理,由“经验驱动”管理向“数据驱动”管理转变;还可将自身用电数据与本用电分析数据进行对标分析,定位自身电量使用及管理水平,为节能提升、运营优化及模式借鉴提供重要依据。1. 数据来源 通过普通住宅内部各个资源点位的电表获取各个资源点位的每日用电数据,包括建筑类型、电表点位、用电时间、日用电量等,并存储到对应数据库中。 2. 数据预处理 以普通住宅电表点位作为唯一标识,在数据库中筛选记录,提取出各个资源点位的日用电量等信息,并通过以下算法规则进行数据分析。 3. 数据分析 普通住宅用电分析数据算法规则: 对各个资源点位的日用电量按所属月份进行加和计算,得到月用电量。 对月用电量加以运算,得到月每日用电量均值,月每日用电量均值=月用电量/当月天数;再对当月每日用电量求取标准差和变异系数,月每日用电量标准差用于监测各个资源点位当月用电的波动情况,月每日用电量变异系数=月每日用电量标准差/月每日用电量均值,消除了量纲影响,便于对各个资源点位进行用电稳定性的横向比较。 在各月用电量数据的基础上,计算当月用电增长率,当月用电增长率=(月用电量-上月用电量)/上月用电量。 各个资源点位中,当月用电增长率大于100%为重点关注资源点位,说明该点位用电需求愈发旺盛,需要警惕异常用电消耗;增长率为负数,且绝对值大于50%以上,说明该点位用电明显减少,需要跟进深入了解情况。
The application scenario of the residential electricity consumption analysis dataset is intelligent monitoring and management of electricity usage in ordinary residential households. By analyzing the electricity consumption data of various meter points in ordinary residential households, including monthly electricity consumption, daily average electricity consumption per month, standard deviation, coefficient of variation, and monthly growth rate, etc., accurate grasp of electricity usage conditions across all locations is achieved, providing decision support for residential property managers to optimize energy management and identify abnormal energy consumption. In addition, other ordinary residential households can learn from this analysis dataset to improve their own electricity usage monitoring and management, shifting from "experience-driven" management to "data-driven" management; they can also conduct benchmarking analysis by comparing their own electricity consumption data with this dataset, positioning their own electricity usage and management levels, providing important basis for energy conservation improvement, operation optimization, and mode reference. 1. Data Source Daily electricity consumption data of each meter point is collected via electricity meters at various resource points inside ordinary residential households, including building type, meter point ID, electricity usage time, daily electricity consumption, etc., and stored in the corresponding database. 2. Data Preprocessing Taking the residential meter point as the unique identifier, records are filtered in the database, information such as daily electricity consumption of each meter point is extracted, and data analysis is carried out according to the following algorithm rules. 3. Data Analysis Algorithm rules for the residential electricity consumption analysis dataset: - Sum the daily electricity consumption of each meter point by their respective months to obtain the monthly electricity consumption. - Calculate the daily average electricity consumption per month based on the monthly electricity consumption, where daily average electricity consumption per month = monthly electricity consumption / number of days in the current month. Then compute the standard deviation and coefficient of variation of the daily electricity consumption of the current month: the daily standard deviation of electricity consumption is used to monitor the electricity usage fluctuation of each meter point in the current month; the daily coefficient of variation of electricity consumption = daily standard deviation of electricity consumption / daily average electricity consumption per month, which eliminates the impact of dimensional units and facilitates horizontal comparison of electricity usage stability across different meter points. - Calculate the monthly electricity growth rate based on the monthly electricity consumption data, where monthly electricity growth rate = (monthly electricity consumption - previous month's electricity consumption) / previous month's electricity consumption. - For all meter points, those with a monthly electricity growth rate greater than 100% are key monitoring points, indicating that the electricity demand at these points is growing and abnormal electricity consumption needs to be alerted; if the growth rate is negative with an absolute value greater than 50%, it means the electricity consumption at these points has decreased significantly, requiring follow-up in-depth investigation.