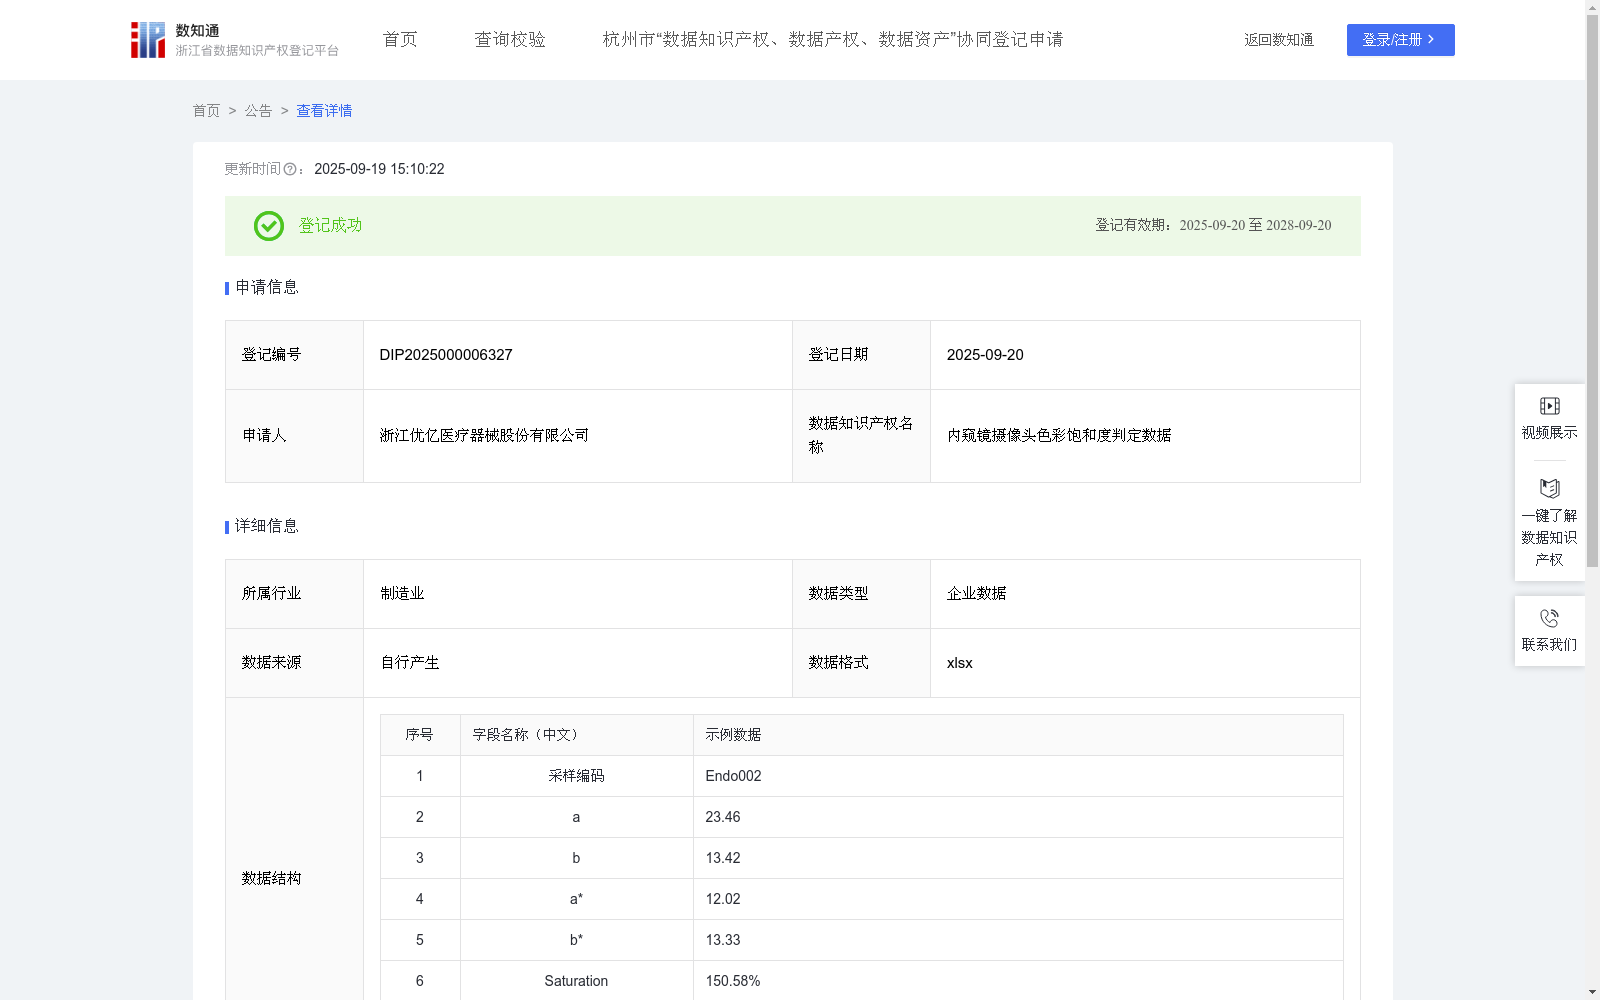
内窥镜摄像头色彩饱和度判定数据
收藏资源简介:
该数据用于测试摄像头拍摄或者录像时的色彩饱和程度,内窥镜进入人体后,摄像头获取到的画面与有光环境下存在偏差,本测试数据通过使用带光源内窥镜的摄像头,在Macbeth III标准对色灯箱下,在自带光源的照度lux和色温下,拍摄24色卡卡,获取颜色空间中的坐标值,通过计算实际颜色和理想颜色的饱和度比值,可以评估颜色的饱和度准确性。在开发基于内窥镜图像的AI辅助诊断系统(如识别息肉、肿瘤、出血点)时,模型对颜色非常敏感。本数据可以为AI团队提供色彩准确的“黄金标准”图像,用于模型训练和测试,避免因设备差异导致AI算法失效。同时本数据建立了一个基于客观数据的、可量化的“色彩真实性”标准,可推动行业标准化,推动整个内窥镜行业在色彩质量评估上形成统一标准,从“经验时代”迈向“数字时代”。1、指标解释:a 表示颜色在红色和绿色之间的色度。它是一个色度轴,用于区分红色和绿色。b 表示颜色在黄色和蓝色之间的色度。它是一个色度轴,用于区分黄色和蓝色。饱和度(Saturation)是颜色的纯度或强度的度量。高饱和度的颜色看起来更鲜艳,而低饱和度的颜色看起来更灰暗。 2、数据处理:把经过拍照系统处理后的值a,b的值与理想值a*,b*进行如下处理:Saturation=Sqrt(a²+b²)/Sqrt(a*²+b*²)。该公式通过比较实际颜色的饱和度与理想颜色的饱和度,来评估颜色的饱和度准确性。 3、数据输出判断标准:若Saturation=1,表示实际颜色和饱和度与理想颜色饱和度相同。若Saturation>1,表示实际颜色的饱和度高于理想颜色,看起来更鲜艳,反之则更灰暗。 设定要求输出的Saturation范围在105%-125%之间(包含端点),满足范围,输出TRUE,反之,输出NG,需要重新使用校准工具进行调整,直到输出TRUE为止。
This dataset is used to test the color saturation level of cameras during shooting or video recording. When an endoscope enters the human body, the images captured by its camera will deviate from those in a well-lit environment. This test data is collected by using an endoscope camera with its own built-in light source, under the Macbeth III standard color light booth, at the illuminance (in lux) and color temperature of the endoscope's built-in light source, by photographing the 24-color checker chart and acquiring the coordinate values in the color space. By calculating the saturation ratio between the actual color and the ideal color, the accuracy of color saturation can be evaluated. When developing AI-assisted diagnosis systems based on endoscope images (such as identifying polyps, tumors and bleeding points), the model is highly sensitive to colors. This dataset can provide AI teams with "gold standard" images with accurate colors for model training and testing, so as to avoid the failure of AI algorithms caused by device differences. In addition, this dataset establishes an objective data-based and quantifiable "color authenticity" standard, which can promote industry standardization, help the entire endoscopy industry form a unified standard for color quality assessment, and shift from the "experience era" to the "digital era". 1. Indicator Explanation: a represents the chromaticity of a color between red and green, and it is a chromaticity axis used to distinguish red and green. b represents the chromaticity of a color between yellow and blue, and it is a chromaticity axis used to distinguish yellow and blue. Saturation is a measure of the purity or intensity of a color. Highly saturated colors look more vivid, while low-saturation colors appear dull. 2. Data Processing: Compare the a and b values processed by the imaging system with the ideal values a* and b* using the following formula: Saturation = √(a² + b²) / √(a*² + b*²) This formula evaluates the accuracy of color saturation by comparing the saturation of the actual color with that of the ideal color. 3. Data Output Judgment Criteria: If Saturation = 1, the actual color saturation is the same as that of the ideal color. If Saturation > 1, the actual color saturation is higher than the ideal one, appearing more vivid; otherwise, it appears dull. It is required that the output Saturation range is between 105% and 125% (including both endpoints). If the value falls within this range, output TRUE; otherwise, output NG, and the calibration tool should be used for adjustment until the output is TRUE.