
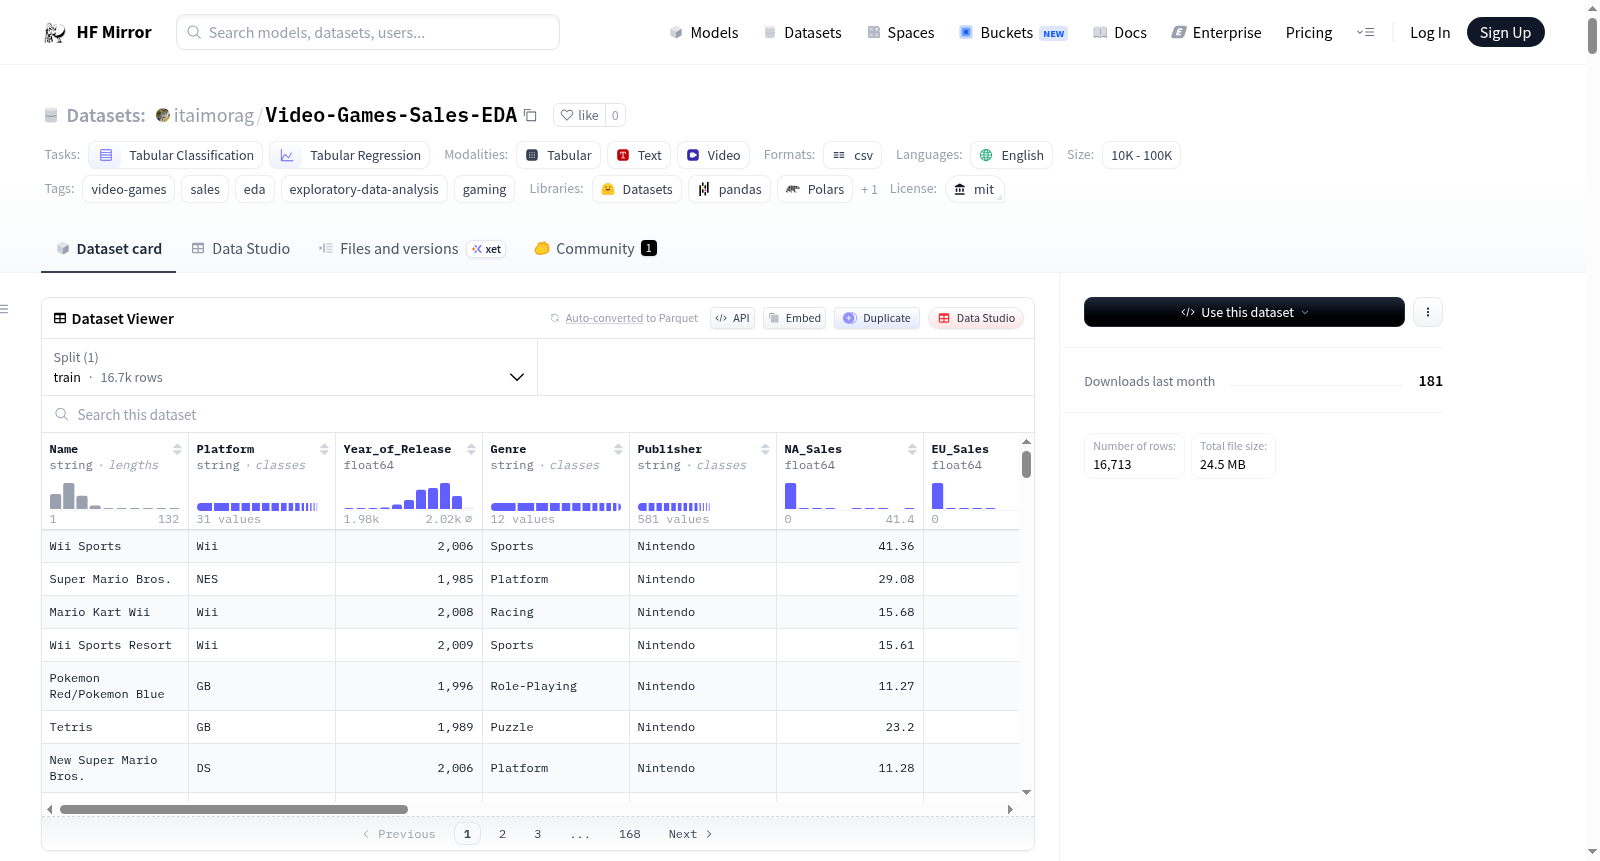
itaimorag/Video-Games-Sales-EDA
收藏Hugging Face2026-04-10 更新2026-04-12 收录
下载链接:
https://hf-mirror.com/datasets/itaimorag/Video-Games-Sales-EDA
下载链接
链接失效反馈官方服务:
资源简介:
---
license: mit
task_categories:
- tabular-classification
- tabular-regression
language:
- en
tags:
- video-games
- sales
- eda
- exploratory-data-analysis
- gaming
pretty_name: 🎮 Video Game Sales History (1980-2016)
size_categories:
- 10K<n<100K
---
# 🎮 Video Game Sales — Exploratory Data Analysis (EDA)
<div align="center">
<h1>Video Presentation</h1>
<p style="color: red;">If I didn’t cover everything it’s because I didn’t have enough time</p>
<video controls width="100%">
<source src="https://huggingface.co/datasets/itaimorag/Video-Games-Sales-EDA/resolve/main/itaimoragvideo.mp4" type="video/mp4">
Your browser does not support the video tag.
</video>
</div>

## Executive Summary
The video game industry is a multi‑billion dollar market characterized by extreme unpredictability—a single "mega‑hit" can generate more revenue than thousands of average games combined. This project analyzes historical video game sales (1980–2016) to uncover the main patterns behind commercial success.
**Key findings:** Action and Sports genres have the highest historical sales volumes, but the market is highly volatile, era‑dependent, and dominated by a small number of outlier hits. Higher critic scores raise the _ceiling_ of potential sales and are more predictive than user scores, but they do not guarantee commercial success, and regional tastes differ substantially.
**Methodology extras (notebook):** Extreme sellers are **named** (top titles) and the long tail is summarized with **Tukey IQR fences** on `Global_Sales`—many rows above the upper fence are expected for hit‑driven sales, and those rows are **kept** as legitimate data. A **Mann–Whitney U** test (median split on `Critic_Score`) provides a **non‑parametric** check on long‑tailed sales; it supports a **rank‑based association**, not causality.
**Engineered fields & missing metadata:** The notebook adds **`Is_Hit`** (top quartile of `Global_Sales`), **`Year_missing`** (flag for unknown release year), and fills **`Publisher` / `Developer`** missing values with **`Unknown`** (no fake company names). Review scores stay **`NaN`** where unknown. A short **sensitivity table** compares a **median‑based** hit rule vs the **75th‑percentile** default.
---
## Navigation
- [Executive Summary](#executive-summary)
- [1. Dataset Description](#1-dataset-description)
- [2. Intended Uses & Audience](#2-intended-uses--audience)
- [3. Dataset Structure](#3-dataset-structure)
- [4. Data Integrity & Cleaning](#4-data-integrity--cleaning)
- [5. Exploratory Data Analysis Highlights](#5-exploratory-data-analysis-highlights)
- [5.1 Market Size & Global Trends](#51-market-size--global-trends)
- [5.2 Demographics & Audience](#52-demographics--audience)
- [5.3 Quality vs Commercial Success](#53-quality-vs-commercial-success)
- [5.4 Hit label, missing metadata & sensitivity](#54-hit-label-missing-metadata--sensitivity)
- [6. Machine Learning Readiness](#6-machine-learning-readiness)
- [7. Strategic Takeaways](#7-strategic-takeaways)
- [8. Limitations](#8-limitations)
- [9. Notebook & Libraries](#9-notebook--libraries)
- [10. Author](#10-author)
---
## 1. Dataset Description
This dataset contains historical sales data and review scores for video games released between 1980 and 2016.
Each row represents a single game release.
### 1.1 Source
The data is based on public video game sales and review aggregators, cleaned and repackaged here for **EDA and ML tasks**.
- **Upstream dataset (Kaggle):** [Video Game Sales with Ratings](https://www.kaggle.com/datasets/rush4ratio/video-game-sales-with-ratings) (curator: **rush4ratio**).
### 1.2 Features
- **Identity**
- `Name`, `Platform`, `Year_of_Release`, `Publisher`
- **Categorization**
- `Genre`, `Rating` (ESRB)
- **Financials** (in **millions of units**)
- `NA_Sales`, `EU_Sales`, `JP_Sales`, `Other_Sales`, `Global_Sales`
- **Reception**
- `Critic_Score`, `Critic_Count`, `User_Score`, `User_Count`
- **Additional**
- `Developer`
**Engineered in the notebook (after cleaning)** — same rows as the cleaned table, extra columns for analysis and ML prep:
| Column | Meaning |
|--------|---------|
| `Is_Hit` | `1` if `Global_Sales` ≥ **75th percentile** on the cleaned data, else `0`. |
| `Year_missing` | `1` if `Year_of_Release` is `NaN`, else `0`. |
| `Publisher` / `Developer` | Missing values replaced with the literal label **`Unknown`**. |
### 1.3 Dataset card & research framing
- **Unit of analysis:** One row per **game title** with **aggregated** regional and global unit sales (not weekly time series).
- **Research focus:** How **genre**, **region**, **ESRB rating**, and **review scores** relate to **global sales**, and how genre‑level demand changed over **1980–2016**.
- **Modeling note:** `Global_Sales` is a natural **regression** target; `Genre`, `Platform`, `Publisher`, `Rating`, and score/count fields are natural predictors for later supervised learning.
---
## 2. Intended Uses & Audience
- **Publishers & investors** – estimate market size and historical performance by genre, platform, and publisher.
- **Indie developers & analysts** – understand genre saturation, realistic sales expectations, and promising niches.
- **Data scientists & ML practitioners** – build models for:
- sales prediction,
- hit vs non‑hit classification,
- portfolio and trend analysis.
### Out-of-scope use
- **Not for post-2016 forecasting** without new data; trends, platforms, and digital share changed after the coverage window.
- **Not for causal business decisions** based on EDA alone (e.g. “publish Action → profit”); associations in the notebook are exploratory, not proven causal effects.
- **Not a substitute for revenue data**; units sold are not price-adjusted and omit many modern monetization models.
---
## 3. Dataset Structure
- **Rows:** ~16.7k games (after cleaning; exact count in notebook output)
- **Columns:** **16** fields from the source file after cleaning, plus **`Year_missing`** and **`Is_Hit`** (**18** columns in the main analysis `DataFrame`). `Publisher` / `Developer` are still those two columns, with missing values recoded to **`Unknown`**.
- **Split:** single `train` split (users create their own train/val/test).
### 3.1 Sample Rows
_Before cleaning_

---
## 4. Data Integrity & Cleaning
Raw game sales data is noisy and inconsistent. These steps were taken to make it analysis‑ready.
### 4.1 Initial State
- Missing identifiers and partial metadata for older titles
- A few implausible `Year_of_Release` values
- `User_Score` as strings with `"tbd"`, forcing an object dtype
- Strong numerical outliers in `Global_Sales` (e.g., _Wii Sports_)
**Missingness reporting:** Both **raw counts** and **percentage of rows** per column were printed so sparse columns (e.g. scores on older titles) are easy to compare at a glance.
**Pre‑cleaning snapshot:**

### 4.2 Cleaning Decisions
- Removed games with `Year_of_Release` after 2016 to avoid partially observed recent years.
- Converted `"tbd"` in `User_Score` to `NaN` and cast back to float.
- Left missing `Critic_Score` / `User_Score` as `NaN` to avoid fabricating scores for eras without aggregators.
- **`Publisher` / `Developer`:** missing → **`Unknown`** (explicit category for groupbys; not a real company name).
- **`Year_of_Release`:** still **`NaN`** when unknown; **`Year_missing`** = `1` on those rows (no median year imputation).
- **`Is_Hit`:** binary label, `1` if `Global_Sales` ≥ **75th percentile** (see §5.4 and notebook).
- Retained extreme best‑sellers; handled their influence via log scaling (or y‑axis caps) in plots rather than dropping them.
- **Categorical profiling:** After cleaning, **object / string columns** were summarized with `describe(include=['object'])` (counts, uniques, top category) to spot sparse labels and typos before plotting. After `Developer.fillna("Unknown")`, **`top`** may show **`Unknown`** if it is the **mode**—compare **`freq`** to **`count`** (see notebook missing‑data policy).
**Post‑cleaning snapshot:**


### 4.3 Summary Statistics After Cleaning

### 4.4 Sanity checks (domain rules)
Automated plausibility checks on the **cleaned** data:
- All regional and **global** sales columns are **non‑negative**.
- `Year_of_Release` lies in a sensible range for this table (and **> 2016** rows were already removed).
- `Critic_Score`, where present, lies in **0–100**.
These catch scrape errors, wrong units, or bad merges before trusting aggregate charts.

### 4.5 Outlier documentation (`Global_Sales`)
- **Top titles table:** The notebook lists the **top 10** games by `Global_Sales` so mega‑hits (_Wii Sports_, etc.) are **explicit**, not only visible as scatter extremes.
- **Tukey IQR fences:** Lower fence = Q1 − 1.5×IQR, upper fence = Q3 + 1.5×IQR. For heavily **right‑skewed** game sales, **many rows** can exceed the upper fence **by expectation**; that is interpreted as structural hit‑driven skew, not automatic grounds to delete rows.
- **Decision:** Keep those rows as **real** sales; use log scales, caps, or robust methods in models as needed.

---
## 5. Exploratory Data Analysis Highlights
### 5.1 Market Size & Global Trends
#### A. Total Global Sales by Genre
**Question:** What are the most profitable genres of all time (by total units sold)?

- **Insight:** Action and Sports dominate absolute sales volumes, with Shooters also crossing the billion‑unit mark.
#### B. Share of Global Sales by Genre (%)
**Question:** What **fraction** of all global sales in the dataset does each genre represent (1980–2016)?
Totals (panel A) show **scale**; percentages show **market composition** (mix), which is how analysts often report structure alongside magnitude.

- **Insight:** The same leaders tend to dominate both totals and shares, but the percentage view makes **relative** weighting explicit for storytelling and slides.
#### C. Genre Popularity Over Time
**Static trend of top genres**

- **Insight:** Platformers and Puzzle titles were strong early; Action and Shooters rise sharply in the 2000s. Genre viability is era‑dependent.
#### D. The Titans of the Industry
**Question:** Which publishers dominate lifetime global sales?

- **Insight:** A small number of publishers (Nintendo, EA, Activision, etc.) control a large share of total units sold.
---
### 5.2 Demographics & Audience
#### A. Regional Taste Differences
**Question:** Do North America, Europe, and Japan prefer different genres?

- **Insight:** NA and EU lean toward Action/Sports/Shooters; Japan strongly prefers Role‑Playing games and contributes little to Shooters.
#### B. ESRB Age Ratings and Sales
**Question:** Does restricting a game to a mature audience limit its sales potential?

- **Insight:** Medians are similar across E, T, M, E10+, but E and M have the highest outliers. Both family‑friendly and mature games can reach very high sales.
#### C. Sales Distribution by Genre (Log Scale)
**Question:** What does typical performance look like within each genre once we control for outliers?

- **Insight:** The median game in almost any genre sells well under one million units; huge totals are driven by a few extreme hits.
---
### 5.3 Quality vs Commercial Success
#### A. Feature Correlations
**Question:** How do review scores relate to sales numerically?

- **Insight:**
- Regional sales correlate strongly with `Global_Sales` (by construction—they are components of global totals in this dataset).
- `Critic_Score` has a **moderate** positive correlation (~0.24–0.25) with `Global_Sales`.
- `User_Score` shows a weaker correlation with `Global_Sales`.
- `Critic_Score` and `User_Score` correlate moderately with each other.
- **`Is_Hit`** vs continuous columns are **point‑biserial** correlations; **`Is_Hit` vs `Global_Sales`** is **near‑perfect by construction** (label derived from global sales).
- **`Year_missing` vs `Year_of_Release`:** pairwise correlation is a **degenerate diagnostic** (missing year aligns with the flag); read the notebook note, not as discovery.
- **Interpretation:** Professional reviews are a better linear predictor of sales than user scores, but still far from deterministic.
#### B. Distribution of Professional Critic Scores
**Question:** How are critic scores distributed overall?

- **Insight:** Scores are slightly left‑skewed and heavily clustered between 65 and 85. In practice, ~70+ behaves like the “average” functioning game.
#### C. Critic Scores vs Global Sales
**Question:** Do higher critic scores actually translate into more sales?

- **Insight:** Very high‑selling games almost all have critic scores above ~80, but many highly rated games still sell modestly. A high score raises the _ceiling_ more than it guarantees a result.
#### D. Critic vs User Alignment
**Question:** Do critics and players agree on quality?

- **Insight:** Points follow an overall upward trend but with wide dispersion above and below the 45° line, indicating both agreement and strong disagreements (e.g., cult classics or controversial titles).
#### E. Stratified view (top genres) & Mann–Whitney U check
**Why facet:** The global scatter (panel C) mixes all genres. The notebook adds **faceted** critic‑vs‑sales plots for the **three genres with the highest lifetime global sales**, with the same **y‑axis cap (~30M)** as the main scatter so the bulk of the distribution stays visible.
**Mann–Whitney U:** Sales are **long‑tailed**, so a simple t‑test is a poor default. The notebook splits games at the **median** `Critic_Score` (among rows with non‑missing score and sales) and runs **`mannwhitneyu(..., alternative='greater')`**: it asks whether the high‑score group has **stochastically larger** sales than the low‑score group (rank‑based). **Interpretation:** A small p‑value supports an association in this non‑parametric sense; it does **not** prove causality (genre, IP, marketing, and platform still dominate outcomes)


---
### 5.4 Hit label, missing metadata & sensitivity
The notebook defines a **commercial hit** as **`Is_Hit = 1`** when `Global_Sales` is at or above the dataset **75th percentile** (≈25% positives). It also compares this to a **median‑threshold** rule (50% positives) in a small **sensitivity table**—useful for discussing how sensitive conclusions are to the cutoff.
1. **Final feature summary**

2. **Hit rate by genre**

3. **Hit rate by platform**

4. **Critic score by `Is_Hit` (box plot)**

5. **Mann–Whitney on `Critic_Score` by `Is_Hit`** — text output with statistic and p‑value.

6. **Sensitivity table** — the `display(sens)` table (median vs 75th percentile cutoffs, `n_hit`, `hit_rate`).

---
## 6. Machine Learning Readiness
- **Scaling / normalization**
- `Global_Sales` (millions), `Critic_Score` (0–100), and `User_Score` (0–10) live on different scales.
- Use `StandardScaler` or `MinMaxScaler` for distance‑based or gradient‑based models.
- **Multicollinearity & target leakage**
- `NA_Sales`, `EU_Sales`, `JP_Sales`, and `Other_Sales` are **not independent** of `Global_Sales` in this table—they are **pieces** of the global total. Do **not** treat all region columns plus `Global_Sales` as unconstrained features and target without a clear design (e.g., predicting **regions** separately, or predicting global while **dropping** regions, or using **shares** with care). Otherwise you risk **redundancy** or **leakage** depending on how the target is defined.
- **Targets**
- Regression: `Global_Sales` or `log(Global_Sales + ε)` to reduce skew.
- Classification: use the notebook’s **`Is_Hit`** (75th percentile of `Global_Sales`) **or** define your own cutoff—document it. Do **not** use `Is_Hit` as a feature when predicting `Global_Sales` (leakage).
- **Useful features**
- Categorical: `Genre`, `Platform`, `Publisher` (includes **`Unknown`**), `Developer` (includes **`Unknown`**), `Rating`, binned `Year_of_Release` where year exists
- Numerical: `Critic_Score`, `User_Score`, `Critic_Count`, `User_Count`, **`Year_missing`**
- Engineered: critic–user gap, **regional shares** (if not leaking the target), log‑sales, time‑decayed features; **`Is_Hit`** only as a **label**, not a regressor for sales.
---
## 7. Strategic Takeaways
1. **Genre shapes opportunity size.**
Action, Sports, and Shooters reach the largest audiences but are also the most saturated genres.
2. **Most games are modest sellers.**
The market is strongly hit‑driven: medians are low, and a handful of blockbusters carry totals.
3. **Reviews help, but aren’t everything.**
Higher critic scores are associated with higher potential sales, but IP strength, marketing, and platform reach remain crucial.
4. **Market power is concentrated.**
Major publishers start with a much higher expected baseline than small studios.
5. **Audience targeting matters.**
Both E and M‑rated games can perform extremely well if genre, platform, and marketing match the intended demographic and region.
---
## 8. Limitations
- Dataset coverage effectively ends in 2016 and does not fully capture the shift to digital‑only, live‑service, or mobile ecosystems.
- Many older titles lack `Critic_Score` / `User_Score` due to the absence of historical aggregators.
- All relationships are correlational, not causal (including the Mann–Whitney result: it is a **distributional** comparison, not proof that “better scores cause sales”).
- **Hit-driven tails:** IQR-style outlier counts on `Global_Sales` can be **large** without implying bad data—interpret alongside the top‑title table and domain knowledge.
- **Representation & coverage:** Sales figures reflect the **retail / physical‑heavy era** and source reporting practices; **NA, EU, and JP** are coarse regions and do not represent the full global market. **Critic and user scores** favor titles and periods covered by major aggregators, with potential **English / Western** tilt and **survivorship** (only games present in the source appear at all).
---
## 9. Notebook & Libraries
The analysis was performed in **Google Colab** using Python.
Main libraries used:
- **Data manipulation:** `pandas`, `numpy`
- **Visualization:** `matplotlib`, `seaborn`
- **Utilities (download/export):** `google.colab.files`
Full analysis with code and interactive plots: [Google Colab](https://huggingface.co/datasets/itaimorag/Video-Games-Sales-EDA/blob/main/Assignment_1_EDA_%26_Dataset_Video_games_sales.ipynb)
---
## 10. Author
**Itay Morag**
---
提供机构:
itaimorag
搜集汇总
数据集介绍
构建方式
该数据集源于Kaggle上公开的视频游戏销售与评分数据,经由系统性的清洗与重构,形成了一个适用于探索性数据分析与机器学习任务的标准化语料库。原始数据包含1980年至2016年间约1.67万款游戏的发行信息,涵盖名称、平台、发布年份、发行商、类型、ESRB分级、北美、欧洲、日本及其他地区的销量(百万套计),以及评论家与用户的评分及评论数量。数据清洗环节剔除了2016年之后的样本,将用户评分中的“tbd”转换为缺失值,对发行商与开发者字段中的缺失项统一标记为“Unknown”,并保留了极端的畅销样本以反映市场真实分布。此外,基于全球销量的75百分位阈值构建了二元标签“Is_Hit”,并添加了标识发布年份缺失的“Year_missing”字段,从而为后续分析提供了更为丰富的特征空间。
特点
该数据集的核心特色在于其对视频游戏市场长尾分布的精细刻画与稳健的非参数统计分析。面对高度右偏的销售数据,项目通过Tukey IQR栅栏识别异常值,但并未将其删除,而是将其视为市场结构性特征予以保留,并建议在建模时采用对数变换或鲁棒方法进行处理。为了量化评论质量与商业成功之间的关系,研究引入了Mann-Whitney U检验,以中位数分割评论家评分,从秩次角度验证了高评分游戏在销量上具有随机占优性,避免了传统t检验在偏态分布下的局限。同时,数据集还提供了基于中位数与75百分位的“Is_Hit”阈值敏感性对照表,帮助用户评估不同定义对结论稳健性的影响。这些设计使得该数据集不仅是一张静态表格,更是一个嵌入了方法论思考的分析工具。
使用方法
该数据集适用于多元化的机器学习任务,涵盖回归与分类两大范式。在回归任务中,可将全球销量(或其对数变换形式)作为目标变量,利用类型、平台、发行商、开发者、ESRB分级、评论家与用户评分及其计数、发布年份缺失标记等作为特征。需要注意的是,区域销量(北美、欧洲、日本等)是全球化销量的组成部分,若将其与全球销量同时纳入模型将导致严重的目标泄漏,因此建议在预测全球销量时舍弃区域字段,或转而将各个区域销量作为独立目标进行建模。在分类任务中,可直接使用预设的“Is_Hit”标签进行畅销品预测,亦可依据业务需求自定义阈值。对于距离敏感或梯度驱动的模型,建议先采用StandardScaler或MinMaxScaler对数值型特征进行归一化处理。
背景与挑战
背景概述
Video-Games-Sales-EDA数据集由研究者itaimorag于近年创建,旨在系统探究1980至2016年间电子游戏销售的历史规律。该数据集整合了来自Kaggle上游公开数据源的游戏销售与评分记录,经过清洗与特征工程,涵盖约16,700款游戏的16个核心字段,包括区域销量、全球销量、发行平台、类型、ESRB评级及评论家与用户评分等。其核心研究问题聚焦于揭示类型、地区、评级与评分等因素如何影响游戏的商业成功,并为销售预测、热门游戏分类等机器学习任务提供标准化基准。该数据集在游戏数据分析领域具有重要影响力,为发行商、开发者及数据科学家提供了理解市场结构与历史趋势的宝贵资源。
当前挑战
该数据集所解决的领域问题在于揭示电子游戏市场的高度不确定性与长尾分布特征——少数“超级爆款”游戏贡献了绝大部分销量,而多数游戏销量惨淡。此外,不同地区(北美、欧洲、日本)对游戏类型的偏好差异显著,评论家评分与用户评分对销量的预测能力也非对称,这些复杂性对构建稳健的预测模型构成挑战。在构建过程中,研究者需处理缺失值(如缺失的发行年份、评分)、异常值(如《Wii Sports》等极端畅销游戏)以及数据清洗中的诸多决策,包括将缺失的发行商与开发者标记为“未知”而非虚构公司名,并保留极端值以反映真实市场结构,同时通过对数缩放与基于百分位数的“热门”标签(Is_Hit)来缓解数据偏态问题。
常用场景
经典使用场景
该数据集在学术与产业界常被用于探究电子游戏销量背后的驱动因素,其核心使用场景包括基于多元特征(如游戏类型、发行平台、ESRB分级、评价分数及发行商等)对全球销量进行回归预测,以及构建二分类模型判别某款游戏是否为商业爆款(Is_Hit)。数据清洗阶段引入了缺失年份标记、评价分数保留原始缺失值等细致操作,为后续建模提供了可靠基础。
实际应用
在实际应用层面,该数据集为游戏发行商与独立开发者提供了市场洞察的工具。例如,发行商可根据历史数据评估不同游戏类型在各区域的销量表现,从而优化投资组合与发行策略;独立开发者可通过分析小众类型的生存空间,规避已被巨头高度占领的赛道。数据集还支持对ESRB分级与销量关系的直观理解,帮助市场营销部门更精准地定位目标受众。
衍生相关工作
该数据集衍生出的相关工作主要集中在销量预测模型的改进与多视角因果推断上。研究者基于此数据集构建了多种回归与分类基线模型,并尝试引入时序特征捕捉游戏销量随年份波动的非平稳性。此外,部分工作聚焦于区域市场异质性分析,通过分解北美、欧洲、日本三地销量,验证了文化差异对游戏接受度的显著调节作用,为跨文化市场营销理论提供了实证支撑。
以上内容由遇见数据集搜集并总结生成



