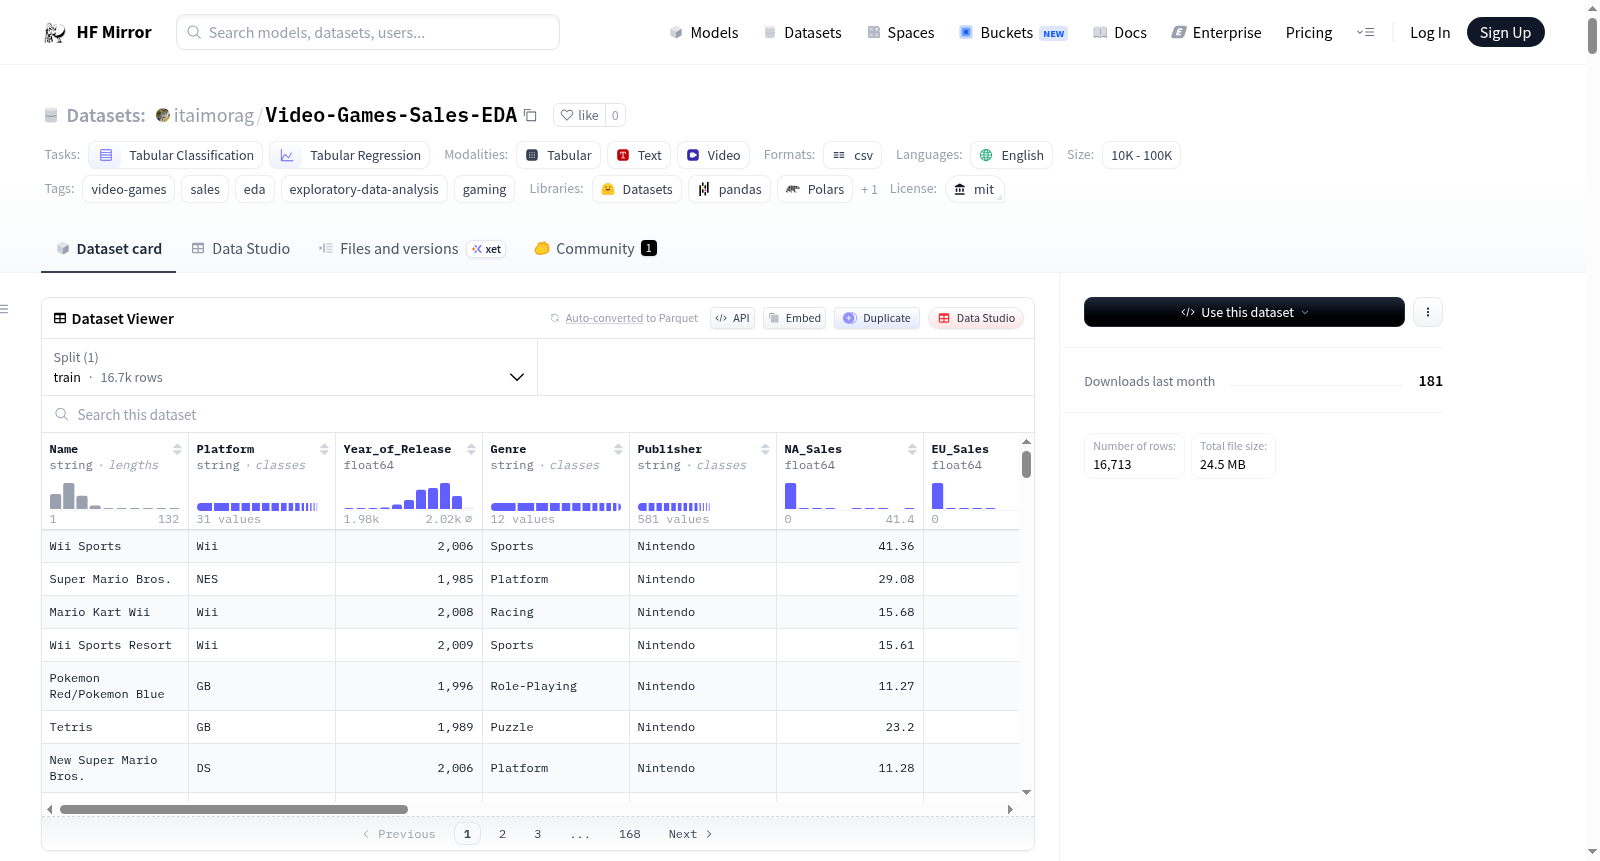
itaimorag/Video-Games-Sales-EDA
收藏资源简介:
--- license: mit task_categories: - tabular-classification - tabular-regression language: - en tags: - video-games - sales - eda - exploratory-data-analysis - gaming pretty_name: 🎮 Video Game Sales History (1980-2016) size_categories: - 10K<n<100K --- # 🎮 Video Game Sales — Exploratory Data Analysis (EDA) <div align="center"> <h1>Video Presentation</h1> <p style="color: red;">If I didn’t cover everything it’s because I didn’t have enough time</p> <video controls width="100%"> <source src="https://huggingface.co/datasets/itaimorag/Video-Games-Sales-EDA/resolve/main/itaimoragvideo.mp4" type="video/mp4"> Your browser does not support the video tag. </video> </div>  ## Executive Summary The video game industry is a multi‑billion dollar market characterized by extreme unpredictability—a single "mega‑hit" can generate more revenue than thousands of average games combined. This project analyzes historical video game sales (1980–2016) to uncover the main patterns behind commercial success. **Key findings:** Action and Sports genres have the highest historical sales volumes, but the market is highly volatile, era‑dependent, and dominated by a small number of outlier hits. Higher critic scores raise the _ceiling_ of potential sales and are more predictive than user scores, but they do not guarantee commercial success, and regional tastes differ substantially. **Methodology extras (notebook):** Extreme sellers are **named** (top titles) and the long tail is summarized with **Tukey IQR fences** on `Global_Sales`—many rows above the upper fence are expected for hit‑driven sales, and those rows are **kept** as legitimate data. A **Mann–Whitney U** test (median split on `Critic_Score`) provides a **non‑parametric** check on long‑tailed sales; it supports a **rank‑based association**, not causality. **Engineered fields & missing metadata:** The notebook adds **`Is_Hit`** (top quartile of `Global_Sales`), **`Year_missing`** (flag for unknown release year), and fills **`Publisher` / `Developer`** missing values with **`Unknown`** (no fake company names). Review scores stay **`NaN`** where unknown. A short **sensitivity table** compares a **median‑based** hit rule vs the **75th‑percentile** default. --- ## Navigation - [Executive Summary](#executive-summary) - [1. Dataset Description](#1-dataset-description) - [2. Intended Uses & Audience](#2-intended-uses--audience) - [3. Dataset Structure](#3-dataset-structure) - [4. Data Integrity & Cleaning](#4-data-integrity--cleaning) - [5. Exploratory Data Analysis Highlights](#5-exploratory-data-analysis-highlights) - [5.1 Market Size & Global Trends](#51-market-size--global-trends) - [5.2 Demographics & Audience](#52-demographics--audience) - [5.3 Quality vs Commercial Success](#53-quality-vs-commercial-success) - [5.4 Hit label, missing metadata & sensitivity](#54-hit-label-missing-metadata--sensitivity) - [6. Machine Learning Readiness](#6-machine-learning-readiness) - [7. Strategic Takeaways](#7-strategic-takeaways) - [8. Limitations](#8-limitations) - [9. Notebook & Libraries](#9-notebook--libraries) - [10. Author](#10-author) --- ## 1. Dataset Description This dataset contains historical sales data and review scores for video games released between 1980 and 2016. Each row represents a single game release. ### 1.1 Source The data is based on public video game sales and review aggregators, cleaned and repackaged here for **EDA and ML tasks**. - **Upstream dataset (Kaggle):** [Video Game Sales with Ratings](https://www.kaggle.com/datasets/rush4ratio/video-game-sales-with-ratings) (curator: **rush4ratio**). ### 1.2 Features - **Identity** - `Name`, `Platform`, `Year_of_Release`, `Publisher` - **Categorization** - `Genre`, `Rating` (ESRB) - **Financials** (in **millions of units**) - `NA_Sales`, `EU_Sales`, `JP_Sales`, `Other_Sales`, `Global_Sales` - **Reception** - `Critic_Score`, `Critic_Count`, `User_Score`, `User_Count` - **Additional** - `Developer` **Engineered in the notebook (after cleaning)** — same rows as the cleaned table, extra columns for analysis and ML prep: | Column | Meaning | |--------|---------| | `Is_Hit` | `1` if `Global_Sales` ≥ **75th percentile** on the cleaned data, else `0`. | | `Year_missing` | `1` if `Year_of_Release` is `NaN`, else `0`. | | `Publisher` / `Developer` | Missing values replaced with the literal label **`Unknown`**. | ### 1.3 Dataset card & research framing - **Unit of analysis:** One row per **game title** with **aggregated** regional and global unit sales (not weekly time series). - **Research focus:** How **genre**, **region**, **ESRB rating**, and **review scores** relate to **global sales**, and how genre‑level demand changed over **1980–2016**. - **Modeling note:** `Global_Sales` is a natural **regression** target; `Genre`, `Platform`, `Publisher`, `Rating`, and score/count fields are natural predictors for later supervised learning. --- ## 2. Intended Uses & Audience - **Publishers & investors** – estimate market size and historical performance by genre, platform, and publisher. - **Indie developers & analysts** – understand genre saturation, realistic sales expectations, and promising niches. - **Data scientists & ML practitioners** – build models for: - sales prediction, - hit vs non‑hit classification, - portfolio and trend analysis. ### Out-of-scope use - **Not for post-2016 forecasting** without new data; trends, platforms, and digital share changed after the coverage window. - **Not for causal business decisions** based on EDA alone (e.g. “publish Action → profit”); associations in the notebook are exploratory, not proven causal effects. - **Not a substitute for revenue data**; units sold are not price-adjusted and omit many modern monetization models. --- ## 3. Dataset Structure - **Rows:** ~16.7k games (after cleaning; exact count in notebook output) - **Columns:** **16** fields from the source file after cleaning, plus **`Year_missing`** and **`Is_Hit`** (**18** columns in the main analysis `DataFrame`). `Publisher` / `Developer` are still those two columns, with missing values recoded to **`Unknown`**. - **Split:** single `train` split (users create their own train/val/test). ### 3.1 Sample Rows _Before cleaning_  --- ## 4. Data Integrity & Cleaning Raw game sales data is noisy and inconsistent. These steps were taken to make it analysis‑ready. ### 4.1 Initial State - Missing identifiers and partial metadata for older titles - A few implausible `Year_of_Release` values - `User_Score` as strings with `"tbd"`, forcing an object dtype - Strong numerical outliers in `Global_Sales` (e.g., _Wii Sports_) **Missingness reporting:** Both **raw counts** and **percentage of rows** per column were printed so sparse columns (e.g. scores on older titles) are easy to compare at a glance. **Pre‑cleaning snapshot:**  ### 4.2 Cleaning Decisions - Removed games with `Year_of_Release` after 2016 to avoid partially observed recent years. - Converted `"tbd"` in `User_Score` to `NaN` and cast back to float. - Left missing `Critic_Score` / `User_Score` as `NaN` to avoid fabricating scores for eras without aggregators. - **`Publisher` / `Developer`:** missing → **`Unknown`** (explicit category for groupbys; not a real company name). - **`Year_of_Release`:** still **`NaN`** when unknown; **`Year_missing`** = `1` on those rows (no median year imputation). - **`Is_Hit`:** binary label, `1` if `Global_Sales` ≥ **75th percentile** (see §5.4 and notebook). - Retained extreme best‑sellers; handled their influence via log scaling (or y‑axis caps) in plots rather than dropping them. - **Categorical profiling:** After cleaning, **object / string columns** were summarized with `describe(include=['object'])` (counts, uniques, top category) to spot sparse labels and typos before plotting. After `Developer.fillna("Unknown")`, **`top`** may show **`Unknown`** if it is the **mode**—compare **`freq`** to **`count`** (see notebook missing‑data policy). **Post‑cleaning snapshot:**   ### 4.3 Summary Statistics After Cleaning  ### 4.4 Sanity checks (domain rules) Automated plausibility checks on the **cleaned** data: - All regional and **global** sales columns are **non‑negative**. - `Year_of_Release` lies in a sensible range for this table (and **> 2016** rows were already removed). - `Critic_Score`, where present, lies in **0–100**. These catch scrape errors, wrong units, or bad merges before trusting aggregate charts.  ### 4.5 Outlier documentation (`Global_Sales`) - **Top titles table:** The notebook lists the **top 10** games by `Global_Sales` so mega‑hits (_Wii Sports_, etc.) are **explicit**, not only visible as scatter extremes. - **Tukey IQR fences:** Lower fence = Q1 − 1.5×IQR, upper fence = Q3 + 1.5×IQR. For heavily **right‑skewed** game sales, **many rows** can exceed the upper fence **by expectation**; that is interpreted as structural hit‑driven skew, not automatic grounds to delete rows. - **Decision:** Keep those rows as **real** sales; use log scales, caps, or robust methods in models as needed.  --- ## 5. Exploratory Data Analysis Highlights ### 5.1 Market Size & Global Trends #### A. Total Global Sales by Genre **Question:** What are the most profitable genres of all time (by total units sold)?  - **Insight:** Action and Sports dominate absolute sales volumes, with Shooters also crossing the billion‑unit mark. #### B. Share of Global Sales by Genre (%) **Question:** What **fraction** of all global sales in the dataset does each genre represent (1980–2016)? Totals (panel A) show **scale**; percentages show **market composition** (mix), which is how analysts often report structure alongside magnitude.  - **Insight:** The same leaders tend to dominate both totals and shares, but the percentage view makes **relative** weighting explicit for storytelling and slides. #### C. Genre Popularity Over Time **Static trend of top genres**  - **Insight:** Platformers and Puzzle titles were strong early; Action and Shooters rise sharply in the 2000s. Genre viability is era‑dependent. #### D. The Titans of the Industry **Question:** Which publishers dominate lifetime global sales?  - **Insight:** A small number of publishers (Nintendo, EA, Activision, etc.) control a large share of total units sold. --- ### 5.2 Demographics & Audience #### A. Regional Taste Differences **Question:** Do North America, Europe, and Japan prefer different genres?  - **Insight:** NA and EU lean toward Action/Sports/Shooters; Japan strongly prefers Role‑Playing games and contributes little to Shooters. #### B. ESRB Age Ratings and Sales **Question:** Does restricting a game to a mature audience limit its sales potential?  - **Insight:** Medians are similar across E, T, M, E10+, but E and M have the highest outliers. Both family‑friendly and mature games can reach very high sales. #### C. Sales Distribution by Genre (Log Scale) **Question:** What does typical performance look like within each genre once we control for outliers?  - **Insight:** The median game in almost any genre sells well under one million units; huge totals are driven by a few extreme hits. --- ### 5.3 Quality vs Commercial Success #### A. Feature Correlations **Question:** How do review scores relate to sales numerically?  - **Insight:** - Regional sales correlate strongly with `Global_Sales` (by construction—they are components of global totals in this dataset). - `Critic_Score` has a **moderate** positive correlation (~0.24–0.25) with `Global_Sales`. - `User_Score` shows a weaker correlation with `Global_Sales`. - `Critic_Score` and `User_Score` correlate moderately with each other. - **`Is_Hit`** vs continuous columns are **point‑biserial** correlations; **`Is_Hit` vs `Global_Sales`** is **near‑perfect by construction** (label derived from global sales). - **`Year_missing` vs `Year_of_Release`:** pairwise correlation is a **degenerate diagnostic** (missing year aligns with the flag); read the notebook note, not as discovery. - **Interpretation:** Professional reviews are a better linear predictor of sales than user scores, but still far from deterministic. #### B. Distribution of Professional Critic Scores **Question:** How are critic scores distributed overall?  - **Insight:** Scores are slightly left‑skewed and heavily clustered between 65 and 85. In practice, ~70+ behaves like the “average” functioning game. #### C. Critic Scores vs Global Sales **Question:** Do higher critic scores actually translate into more sales?  - **Insight:** Very high‑selling games almost all have critic scores above ~80, but many highly rated games still sell modestly. A high score raises the _ceiling_ more than it guarantees a result. #### D. Critic vs User Alignment **Question:** Do critics and players agree on quality?  - **Insight:** Points follow an overall upward trend but with wide dispersion above and below the 45° line, indicating both agreement and strong disagreements (e.g., cult classics or controversial titles). #### E. Stratified view (top genres) & Mann–Whitney U check **Why facet:** The global scatter (panel C) mixes all genres. The notebook adds **faceted** critic‑vs‑sales plots for the **three genres with the highest lifetime global sales**, with the same **y‑axis cap (~30M)** as the main scatter so the bulk of the distribution stays visible. **Mann–Whitney U:** Sales are **long‑tailed**, so a simple t‑test is a poor default. The notebook splits games at the **median** `Critic_Score` (among rows with non‑missing score and sales) and runs **`mannwhitneyu(..., alternative='greater')`**: it asks whether the high‑score group has **stochastically larger** sales than the low‑score group (rank‑based). **Interpretation:** A small p‑value supports an association in this non‑parametric sense; it does **not** prove causality (genre, IP, marketing, and platform still dominate outcomes)   --- ### 5.4 Hit label, missing metadata & sensitivity The notebook defines a **commercial hit** as **`Is_Hit = 1`** when `Global_Sales` is at or above the dataset **75th percentile** (≈25% positives). It also compares this to a **median‑threshold** rule (50% positives) in a small **sensitivity table**—useful for discussing how sensitive conclusions are to the cutoff. 1. **Final feature summary**  2. **Hit rate by genre**  3. **Hit rate by platform**  4. **Critic score by `Is_Hit` (box plot)**  5. **Mann–Whitney on `Critic_Score` by `Is_Hit`** — text output with statistic and p‑value.  6. **Sensitivity table** — the `display(sens)` table (median vs 75th percentile cutoffs, `n_hit`, `hit_rate`).  --- ## 6. Machine Learning Readiness - **Scaling / normalization** - `Global_Sales` (millions), `Critic_Score` (0–100), and `User_Score` (0–10) live on different scales. - Use `StandardScaler` or `MinMaxScaler` for distance‑based or gradient‑based models. - **Multicollinearity & target leakage** - `NA_Sales`, `EU_Sales`, `JP_Sales`, and `Other_Sales` are **not independent** of `Global_Sales` in this table—they are **pieces** of the global total. Do **not** treat all region columns plus `Global_Sales` as unconstrained features and target without a clear design (e.g., predicting **regions** separately, or predicting global while **dropping** regions, or using **shares** with care). Otherwise you risk **redundancy** or **leakage** depending on how the target is defined. - **Targets** - Regression: `Global_Sales` or `log(Global_Sales + ε)` to reduce skew. - Classification: use the notebook’s **`Is_Hit`** (75th percentile of `Global_Sales`) **or** define your own cutoff—document it. Do **not** use `Is_Hit` as a feature when predicting `Global_Sales` (leakage). - **Useful features** - Categorical: `Genre`, `Platform`, `Publisher` (includes **`Unknown`**), `Developer` (includes **`Unknown`**), `Rating`, binned `Year_of_Release` where year exists - Numerical: `Critic_Score`, `User_Score`, `Critic_Count`, `User_Count`, **`Year_missing`** - Engineered: critic–user gap, **regional shares** (if not leaking the target), log‑sales, time‑decayed features; **`Is_Hit`** only as a **label**, not a regressor for sales. --- ## 7. Strategic Takeaways 1. **Genre shapes opportunity size.** Action, Sports, and Shooters reach the largest audiences but are also the most saturated genres. 2. **Most games are modest sellers.** The market is strongly hit‑driven: medians are low, and a handful of blockbusters carry totals. 3. **Reviews help, but aren’t everything.** Higher critic scores are associated with higher potential sales, but IP strength, marketing, and platform reach remain crucial. 4. **Market power is concentrated.** Major publishers start with a much higher expected baseline than small studios. 5. **Audience targeting matters.** Both E and M‑rated games can perform extremely well if genre, platform, and marketing match the intended demographic and region. --- ## 8. Limitations - Dataset coverage effectively ends in 2016 and does not fully capture the shift to digital‑only, live‑service, or mobile ecosystems. - Many older titles lack `Critic_Score` / `User_Score` due to the absence of historical aggregators. - All relationships are correlational, not causal (including the Mann–Whitney result: it is a **distributional** comparison, not proof that “better scores cause sales”). - **Hit-driven tails:** IQR-style outlier counts on `Global_Sales` can be **large** without implying bad data—interpret alongside the top‑title table and domain knowledge. - **Representation & coverage:** Sales figures reflect the **retail / physical‑heavy era** and source reporting practices; **NA, EU, and JP** are coarse regions and do not represent the full global market. **Critic and user scores** favor titles and periods covered by major aggregators, with potential **English / Western** tilt and **survivorship** (only games present in the source appear at all). --- ## 9. Notebook & Libraries The analysis was performed in **Google Colab** using Python. Main libraries used: - **Data manipulation:** `pandas`, `numpy` - **Visualization:** `matplotlib`, `seaborn` - **Utilities (download/export):** `google.colab.files` Full analysis with code and interactive plots: [Google Colab](https://huggingface.co/datasets/itaimorag/Video-Games-Sales-EDA/blob/main/Assignment_1_EDA_%26_Dataset_Video_games_sales.ipynb) --- ## 10. Author **Itay Morag** ---