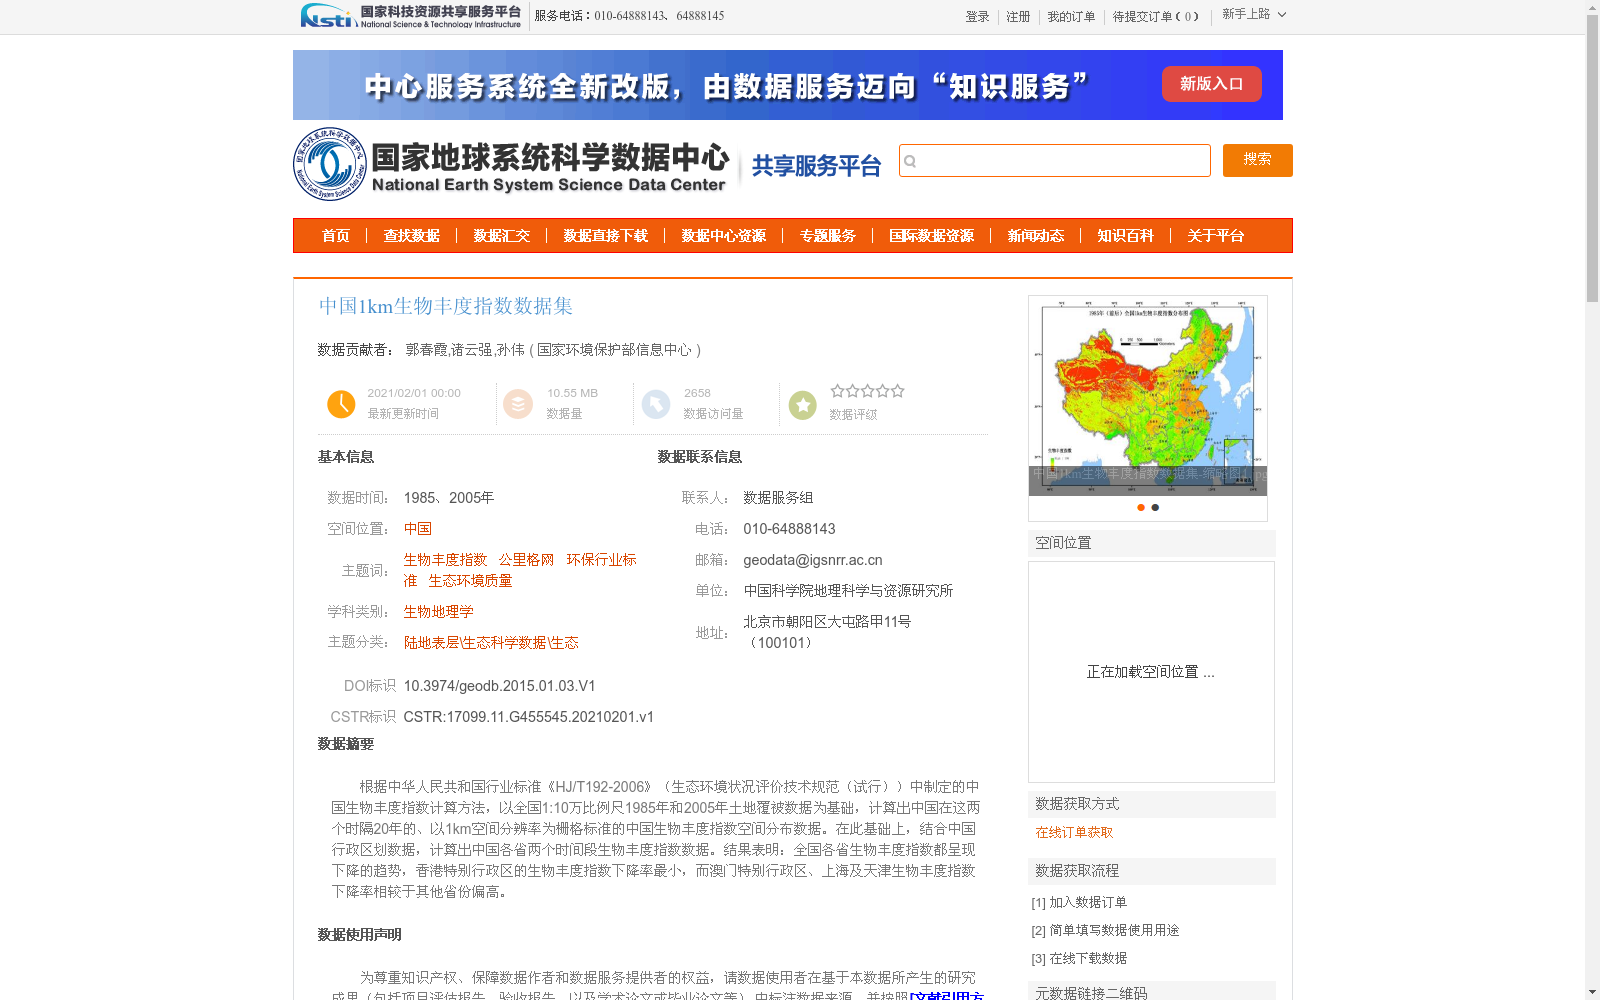
中国1km生物丰度指数数据集
收藏国家地球系统科学数据中心2021-02-01 更新2024-04-21 收录
下载链接:
https://www.geodata.cn/data/datadetails.html?dataguid=455545&docId=11514
下载链接
链接失效反馈官方服务:
资源简介:
根据中华人民共和国行业标准《HJ/T192-2006》(生态环境状况评价技术规范(试行))中制定的中国生物丰度指数计算方法,以全国1:10万比例尺1985年和2005年土地覆被数据为基础,计算出中国在这两个时隔20年的、以1km空间分辨率为栅格标准的中国生物丰度指数空间分布数据。在此基础上,结合中国行政区划数据,计算出中国各省两个时间段生物丰度指数数据。结果表明:全国各省生物丰度指数都呈现下降的趋势,香港特别行政区的生物丰度指数下降率最小,而澳门特别行政区、上海及天津生物丰度指数下降率相较于其他省份偏高。
Based on the calculation method for China's Biological Abundance Index specified in the Industry Standard of the People's Republic of China HJ/T192-2006 *Technical Specifications for Eco-Environmental Status Assessment (Trial)*, this dataset was developed using national land cover data at a scale of 1:100,000 for the years 1985 and 2005. We first generated the spatially distributed dataset of China's Biological Abundance Index for these two 20-year-separated periods, with a 1 km spatial resolution as the grid standard. On this basis, combined with China's administrative division data, we further calculated the Biological Abundance Index values for each provincial-level administrative region in China across the two time periods. The results show that the Biological Abundance Index of all provincial-level administrative regions across the country exhibits a downward trend. The Hong Kong Special Administrative Region has the smallest decline rate of the Biological Abundance Index, while the Macao Special Administrative Region, Shanghai and Tianjin have relatively higher decline rates compared with other provinces.
提供机构:
国家环境保护部信息中心
创建时间:
2021-02-01
搜集汇总
数据集介绍
背景与挑战
背景概述
该数据集是基于中国行业标准《HJ/T192-2006》和1:10万土地覆被数据,计算得出的1985年和2005年中国1km空间分辨率生物丰度指数空间分布数据,用于评估生态环境质量。数据集覆盖全国范围,以WGS-84地理坐标系投影,并提供了各省生物丰度指数变化分析,结果显示全国各省指数均呈下降趋势,其中香港下降率最小,而澳门、上海和天津下降率较高。数据来源于国家地球系统科学数据中心,适用于生物地理学和生态科学研究。
以上内容由遇见数据集搜集并总结生成


