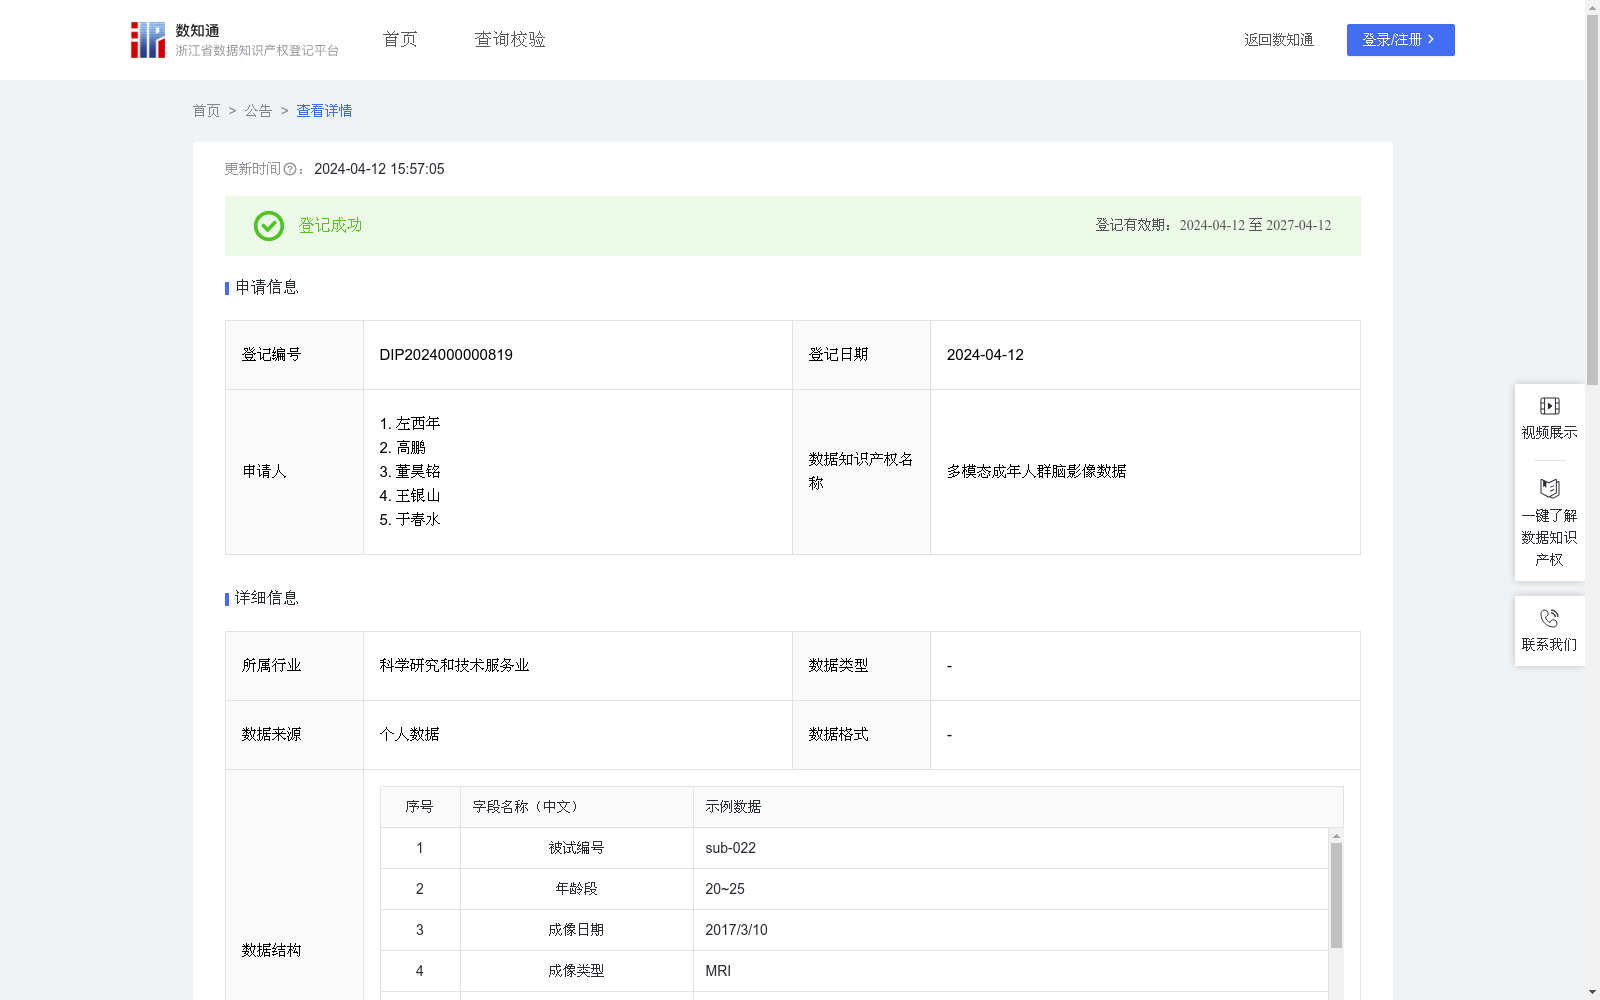
多模态成年人群脑影像数据
收藏浙江省数据知识产权登记平台2024-04-12 更新2024-05-08 收录
下载链接:
https://www.zjip.org.cn/home/announce/trends/32375
下载链接
链接失效反馈官方服务:
资源简介:
健康成年人脑影像数据库提供了一系列详细的脑部影像资料,对脑科学研究、疾病诊断、神经科学教育以及人类行为理解等领域具有重要的应用价值。本数据集包含18-30岁,共计215个健康成人的高分辨率大脑磁共振成像数据,旨在为研究人员提供关于正常大脑功能和结构的基准信息。可以用于观察和分析成年人大脑的结构和功能特征,进而研究大脑的认知过程,如学习、记忆、情感处理等方面。应用场景具体如下:
一、脑科学研究:在脑科学领域,健康成年人脑影像数据库可以广泛用于理解大脑的结构和功能。通过脑影像数据计算挖掘,能够揭示大脑各个区域的特定功能,以及这些区域是如何相互协作的。此外,该数据库还可以用于研究大脑的发育过程,以及随着年龄增长大脑结构的变化。
二、神经疾病的早期诊断:利用健康成年人的脑影像数据库,医生和研究人员可以更准确地识别出神经退行性疾病(如阿尔茨海默症)的早期迹象。通过与健康人脑影像的对比,可以早期发现脑组织的微小变化,这对于疾病的早期诊断和治疗至关重要。
三、人工智能与机器学习:在人工智能和机器学习领域,这些数据库提供了大量的数据用于训练算法。通过该健康成年人脑影像数据库,AI系统可以更好地学习识别脑部疾病,或者在神经科学研究中进行模式识别。
四、教育与培训:在神经科学和医学教育中,该数据库为学生提供了丰富的学习资源。学生可以通过分析这些脑影像来了解大脑结构和功能,增强他们对神经解剖学和神经生理学的理解。
五、跨学科研究:该健康成年人脑影像数据库能够促进跨学科研究的发展。例如,心理学家可以利用这些数据来研究认知过程和情绪反应,而社会科学家可以研究社会行为与大脑活动之间的关系。
总的来说,该健康成年人脑影像数据库是一个多功能的资源,在多个领域中都有广泛的应用前景。随着技术的进步和数据量的增加,该数据库在未来的科学研究和临床应用中将发挥更加重要的作用。在中国健康人脑数据库的处理过程中,采用模块化、层级式的设计架构,使用空间变换、时间分解、特征提取等方法,将宏观尺度的人脑连接组进行数据清理、匿名化和预处理,个体连接组图谱绘制和数据挖掘及知识发现三个等级的计算,精确地分提取、分析和整合了大量的脑结构和功能数据。可以应用于多种规模(如个体、群体、社会)的大脑研究模型中,对于神经科学研究及本土化数据共享具有重要的意义。简要说明如下:
步骤1:数据获取和预处理
1. 数据收集:从健康成年人志愿者中收集fMRI数据,包括结构和静息态功能脑影像。
2. 数据匿名化:针对志愿者的人口学信息,删除其姓名;针对影像中的隐私信息,开发了面部遮罩工具,通过对面部区域识别和灰度值的变化,实现个体面部图像的匿名化。
3. 预处理:包括时间校正、空间标准化、平滑处理等,以减少运动伪影和设备差异的影响。
4. 去除非脑区域:使用脑部模板去除非脑区域数据,确保分析的准确性。
步骤2:特征提取
1. 时域分析:提取脑活动信号的时间序列,分析不同脑区在时间上的激活模式。
2. 空间模式分析:利用类似于独立成分分析的技术提取空间激活模式。
3. 网络分析:使用图理论方法分析脑区之间的功能连接和网络结构。
步骤3:指标计算
1. 皮层厚度:在对MRI图像数据进行预处理后,识别并分割大脑皮层的灰质和白质边界,重建出代表大脑皮层表面的三维模型。在重建的皮层表面模型基础上,计算皮层表面每个体素点灰质和白质边界之间的距离,即为皮层厚度。
2. 皮层表面积:在对MRI图像数据进行预处理后,自动或半自动地对脑组织进行分割,区分出大脑的灰质、白质和脑脊液等部分。随后在灰质和白质之间的边界上生成一个三维的皮层表面模型,这个模型通常由数以万计的小多边形组成,这些多边形紧密拼合以形成整个大脑皮层的连续表面。最后,计算组成皮层表面的所有小多边形的面积之和,完成皮层表面积的计算。
3. 灰质体积:在对MRI图像数据进行预处理和对脑组织进行分割提取后,得到灰质体素的空间分布,其中每个灰质像素代表一小块实际的大脑灰质组织。结合MRI扫描的分辨率,计算这些像素的总数并将其乘以单个像素的体积,得到整个大脑灰质的体积。
4. 低频波动振荡:对fMRI数据进行预处理,在大脑的特定区域或全脑范围内提取BOLD信号的时间序列。随后使用时间序列分析技术,如快速傅里叶变换或小波变换,将时间序列数据分解成不同频率的成分。最后提取0.01到0.1Hz范围内的成分,计算这个频率范围内的功率谱密度或其他相关度量,以评估低频波动振荡的强度和特征。
5. 局部一致性:过fMRI进行预处理后,对于大脑中的每个体素,提取其BOLD信号的时间序列。选取一个特定体素及其周围的邻近体素,计算这些体素的时间序列之间的肯德尔和谐系数,从而得到该体素的局部一致性。
6. 功能同伦:在完成fMRI数据预处理后,提取每个体素的时间序列。对于大脑中的每个体素,确定其在另一大脑半球中的对称体素。对于每一对镜像对称的体素,计算它们的时间序列之间皮尔森相关系数,用于评估大脑两半球之间的功能同伦。
The Healthy Adult Brain Imaging Database provides a comprehensive set of detailed brain imaging materials, which holds important application value in fields such as brain science research, disease diagnosis, neuroscience education, and human behavior understanding. This dataset contains high-resolution brain magnetic resonance imaging (MRI) data from 215 healthy adults aged 18 to 30, aiming to provide researchers with benchmark information on normal brain structure and function. It can be used to observe and analyze the structural and functional characteristics of the adult brain, and further study cognitive processes of the brain, such as learning, memory, emotional processing, and other aspects. The specific application scenarios are as follows:
1. Brain Science Research: In the field of brain science, the Healthy Adult Brain Imaging Database can be widely used to understand the structure and function of the brain. Through computational mining of brain imaging data, we can reveal the specific functions of various brain regions and how these regions cooperate with each other. In addition, this database can also be used to study brain developmental processes and changes in brain structure with age.
2. Early Diagnosis of Neurological Diseases: Using the Healthy Adult Brain Imaging Database, clinicians and researchers can more accurately identify early signs of neurodegenerative diseases (such as Alzheimer's disease). By comparing with brain imaging data of healthy individuals, subtle changes in brain tissue can be detected at an early stage, which is crucial for early diagnosis and treatment of diseases.
3. Artificial Intelligence and Machine Learning: In the fields of artificial intelligence and machine learning, these databases provide a large amount of data for algorithm training. Through this Healthy Adult Brain Imaging Database, AI systems can better learn to recognize brain diseases, or perform pattern recognition in neuroscience research.
4. Education and Training: In neuroscience and medical education, this database provides rich learning resources for students. Students can understand brain structure and function by analyzing these brain images, enhancing their understanding of neuroanatomy and neurophysiology.
5. Interdisciplinary Research: This Healthy Adult Brain Imaging Database can promote the development of interdisciplinary research. For example, psychologists can use these data to study cognitive processes and emotional responses, while social scientists can study the relationship between social behavior and brain activity.
Overall, this Healthy Adult Brain Imaging Database is a multifunctional resource with broad application prospects in multiple fields. With the advancement of technology and the increase of data volume, this database will play a more important role in future scientific research and clinical applications. During the processing of the Chinese Healthy Human Brain Database, a modular and hierarchical design architecture was adopted, using methods such as spatial transformation, time decomposition, and feature extraction to perform three levels of computation on macro-scale human brain connectomes: data cleaning, anonymization and preprocessing, individual connectome mapping, data mining and knowledge discovery. It accurately extracts, analyzes and integrates a large amount of brain structural and functional data, which can be applied to brain research models of various scales (such as individual, group, and society), and is of great significance for neuroscience research and localized data sharing. The brief description is as follows:
Step 1: Data Acquisition and Preprocessing
1. Data Collection: Collect fMRI data, including structural and resting-state functional brain images, from healthy adult volunteers.
2. Data Anonymization: Delete the names of volunteers from their demographic information; for privacy information in the images, a facial masking tool was developed, which achieves anonymization of individual facial images by recognizing facial regions and changes in grayscale values.
3. Preprocessing: Includes time correction, spatial normalization, smoothing, etc., to reduce the impact of motion artifacts and equipment differences.
4. Removal of Non-brain Regions: Use brain templates to remove non-brain region data to ensure the accuracy of analysis.
Step 2: Feature Extraction
1. Time-domain Analysis: Extract the time series of brain activity signals, and analyze the temporal activation patterns of different brain regions.
2. Spatial Pattern Analysis: Use techniques similar to Independent Component Analysis (ICA) to extract spatial activation patterns.
3. Network Analysis: Use graph theory methods to analyze functional connections and network structures between brain regions.
Step 3: Indicator Calculation
1. Cortical Thickness: After preprocessing MRI image data, identify and segment the gray matter and white matter boundaries of the cerebral cortex, and reconstruct a three-dimensional model representing the cerebral cortical surface. Based on the reconstructed cortical surface model, calculate the distance between the gray matter and white matter boundaries of each voxel point on the cortical surface, which is the cortical thickness.
2. Cortical Surface Area: After preprocessing MRI image data, automatically or semi-automatically segment brain tissue to distinguish parts such as the gray matter, white matter, and cerebrospinal fluid of the brain. Then generate a three-dimensional cortical surface model on the boundary between gray matter and white matter, which is usually composed of tens of thousands of small polygons that are closely fitted to form a continuous surface of the entire cerebral cortex. Finally, calculate the sum of the areas of all small polygons constituting the cortical surface to complete the calculation of cortical surface area.
3. Gray Matter Volume: After preprocessing MRI image data and segmenting and extracting brain tissue, the spatial distribution of gray matter voxels is obtained, where each gray matter voxel represents a small piece of actual brain gray matter tissue. Combining the resolution of the MRI scan, calculate the total number of these voxels and multiply it by the volume of a single voxel to obtain the volume of the entire cerebral gray matter.
4. Low-frequency Fluctuation Oscillation: Preprocess fMRI data, and extract the time series of Blood Oxygen Level Dependent (BOLD) signals in specific brain regions or the whole brain. Then use time series analysis techniques such as fast Fourier transform or wavelet transform to decompose the time series data into components of different frequencies. Finally, extract the components in the range of 0.01 to 0.1 Hz, and calculate the power spectral density or other related metrics in this frequency range to evaluate the intensity and characteristics of low-frequency fluctuation oscillation.
5. Regional Homogeneity (ReHo): After preprocessing fMRI, extract the time series of the BOLD signal for each voxel in the brain. Select a specific voxel and its surrounding neighboring voxels, and calculate the Kendall's coefficient of concordance between the time series of these voxels to obtain the regional homogeneity of this voxel.
6. Functional Homotopy: After completing fMRI data preprocessing, extract the time series of each voxel. For each voxel in the brain, determine its symmetric voxel in the opposite cerebral hemisphere. For each pair of mirror-symmetric voxels, calculate the Pearson correlation coefficient between their time series, which is used to evaluate the functional homotopy between the two cerebral hemispheres.
提供机构:
左西年,高鹏,董昊铭,王银山,于春水
创建时间:
2024-03-28
搜集汇总
数据集介绍
以上内容由遇见数据集搜集并总结生成


