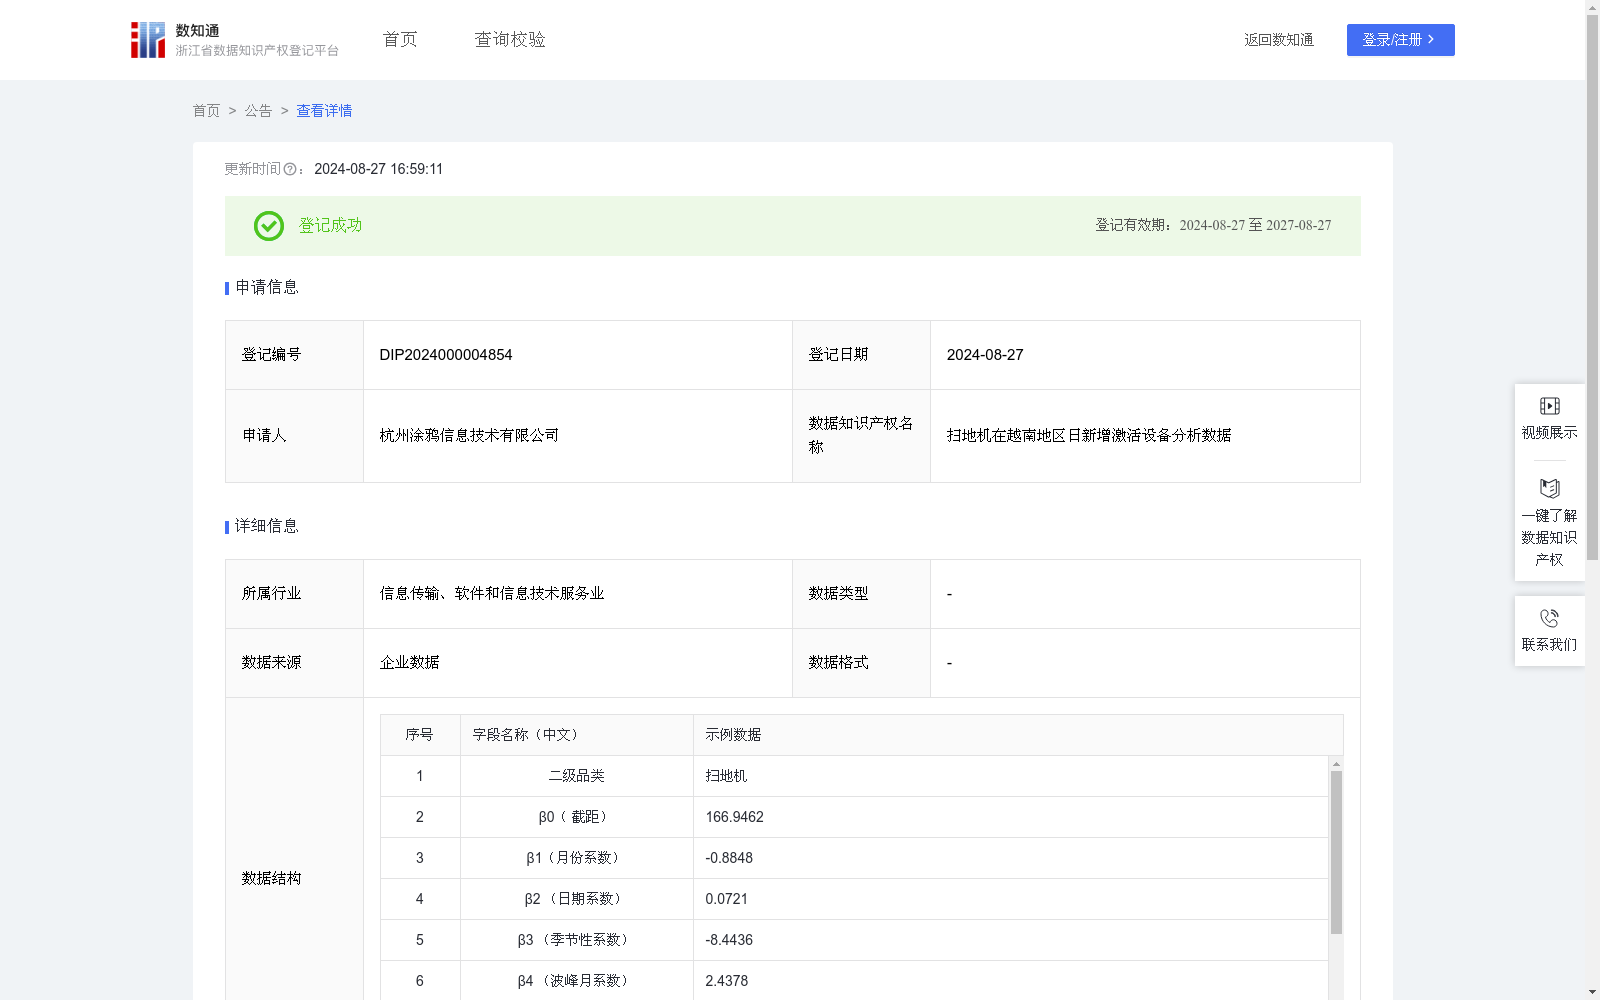
扫地机在越南地区日新增激活设备分析数据
收藏浙江省数据知识产权登记平台2024-08-27 更新2024-08-28 收录
下载链接:
https://www.zjip.org.cn/home/announce/trends/55191
下载链接
链接失效反馈官方服务:
资源简介:
随着智能家居设备的广泛普及,扫地机器人作为一种常见的家用智能设备,其市场需求和用户活跃度是企业比较关心的内容。通过预测未来周期的设备数据,企业可以更好地了解市场趋势,做出更合理的生产管理和营销决策。1. 模型选择:采用多元线性回归模型进行建模,根据扫地机每天新激活设备数-实际值,预测扫地机在未来一段时间的日新增激活设备数;
2. 模型原理:多元回归分析常用于研究两个或以上自变量与一个因变量之间的线性关系。本次分析目标是预测未来一段时间激活设备数,我们将考虑以下自变量:月份、日期、季节性波动,并考虑高峰/低谷影响;
3. 建模与结果预测:考虑季节波动,增加季节性特征;结合峰值异常剧增影响,故再增加高峰月份特征,然后进行回归模型的训练;最终优化下来,该回归模型表达式为:Y=β0+β1*X1+β2*X2+β3*X3+β4*X4。其中,Y为要预测的因变量、X1为月份、X2为日期、X3为季节特征、X4是否高峰期,β0为截距,通过最小二乘法在模型拟合过程中计算得出,取值为166.9462)、β1~β4是自变量的回归系数,β1=-0.8848(月份系数),β2=0.0721(日期系数),β3=-8.4436(季节性系数),β4=2.4378(波峰月系数)。通过回归表达式,预测未来一段时间越南地区扫地机每日新激活设备数。
With the widespread popularization of smart home devices, robotic vacuum cleaners are common household intelligent equipment, and their market demand and user activity are key concerns for enterprises. By forecasting device data across future cycles, enterprises can better grasp market trends and make more rational production management and marketing decisions.
1. Model Selection: A multiple linear regression model is adopted for modeling. Based on the actual daily newly activated robotic vacuum devices, we predict the daily newly activated count of robotic vacuums over a future period.
2. Model Principle: Multiple regression analysis is commonly utilized to examine the linear relationship between two or more independent variables and one dependent variable. The goal of this analysis is to forecast the number of activated devices over a future period, and the following independent variables are considered: month, date, seasonal fluctuations, as well as peak/trough impacts.
3. Modeling and Result Prediction: Considering seasonal fluctuations, seasonal features are incorporated; combined with the impact of abnormal sharp surges in peak periods, peak month features are further added before training the regression model. After final optimization, the regression model expression is: $Y=eta_0+eta_1*X_1+eta_2*X_2+eta_3*X_3+eta_4*X_4$. Here, $Y$ is the dependent variable to be predicted, $X_1$ represents month, $X_2$ represents date, $X_3$ represents seasonal features, $X_4$ indicates whether it is a peak month, $eta_0$ is the intercept, which is calculated via the least squares method during model fitting with a value of 166.9462; $eta_1$ to $eta_4$ are the regression coefficients of the independent variables, specifically $eta_1=-0.8848$ (month coefficient), $eta_2=0.0721$ (date coefficient), $eta_3=-8.4436$ (seasonal coefficient), $eta_4=2.4378$ (peak month coefficient). This regression expression is used to predict the daily newly activated count of robotic vacuum cleaners in the Vietnamese region over a future period.
提供机构:
杭州涂鸦信息技术有限公司
创建时间:
2024-08-02
搜集汇总
数据集介绍
以上内容由遇见数据集搜集并总结生成


