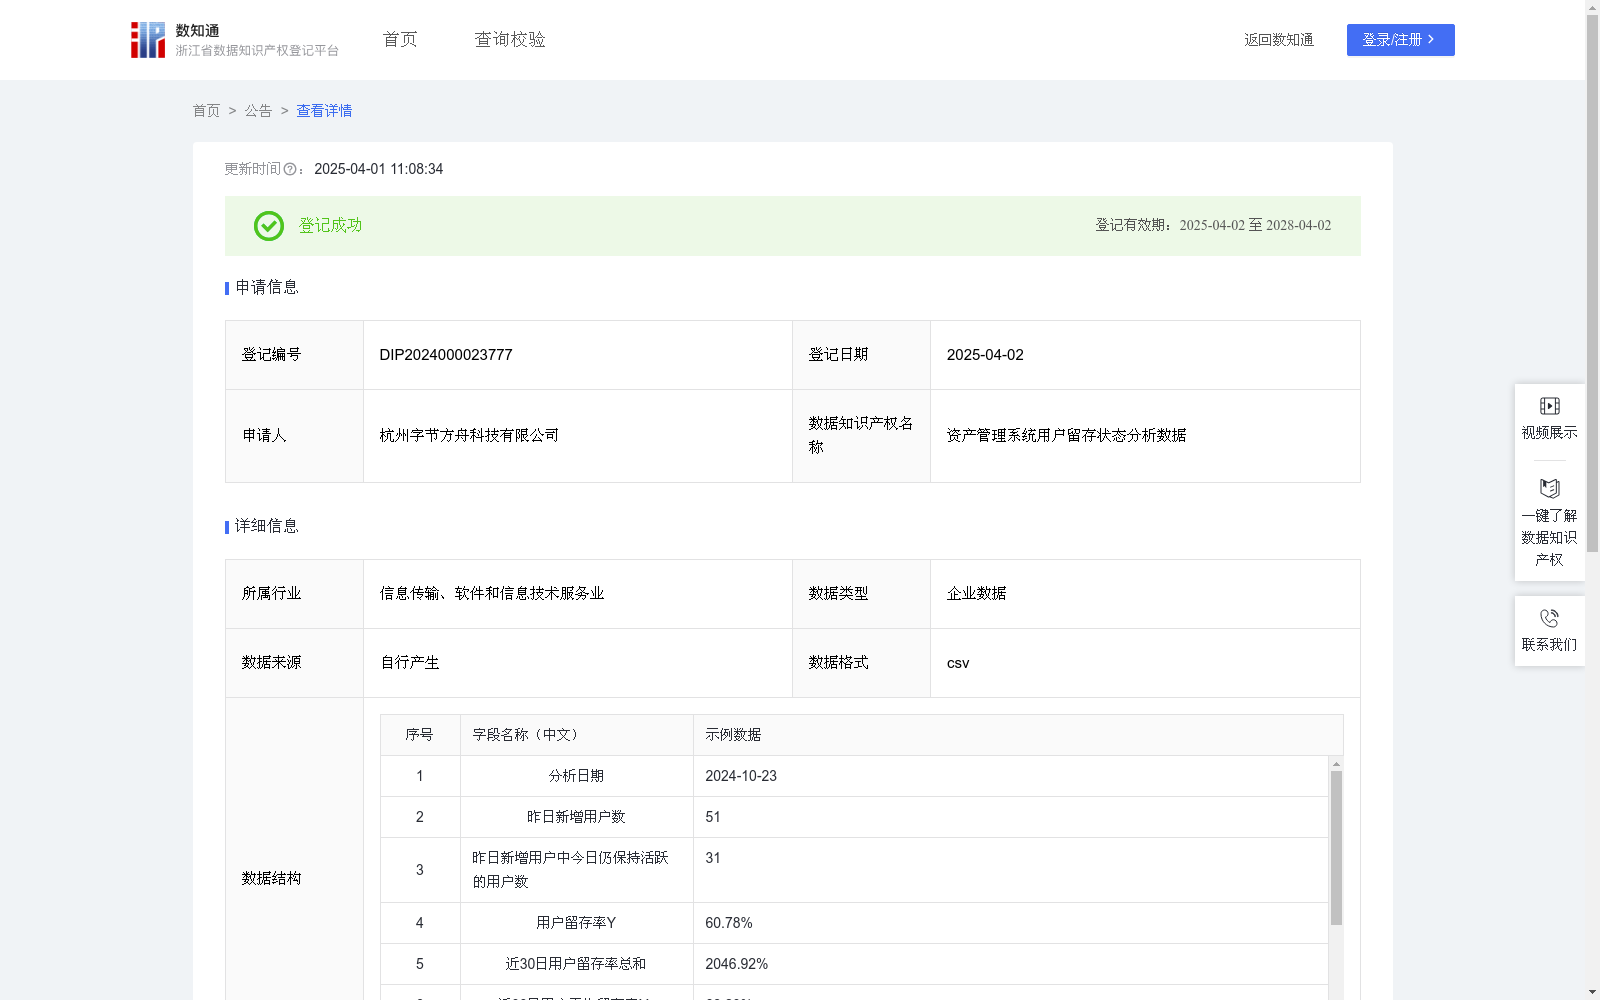
资产管理系统用户留存状态分析数据
收藏资源简介:
本数据集的应用场景如下:(1)风险预警与应对: 用户留存状态分析结果可以作为风险管理的工具,帮助公司提前发现资产管理系统潜在的用户流失风险,并采取措施进行干预,以减少用户流失。(2)投资决策:用户留存率可以揭示产品的市场竞争力和发展前景,投资人可以参考本数据来评估资产管理服务行业的市场表现和增长潜力,做出明智的投资决策。(3)用户行为理解:本数据提供了资产管理系统用户留存行为的量化数据,有助于类似系统的开发企业理解用户在使用产品过程中的留存行为模式。(4)行业趋势分析:对于整个资产管理服务行业而言,本系统的用户留存分析结果可以作为市场趋势分析和预测的重要参考。1.数据采集和预处理:(1)从公司运营的资产管理系统的日志中,收集用户的新增与活跃情况数据,数据字段包括分析日期、昨日新增用户数、昨日新增用户中今日仍保持活跃的用户数。(2)对收集的数据进行清洗,检查并去除异常数据点。 2.计算用户留存率Y:用户留存率Y=昨日新增用户中今日仍保持活跃的用户数/昨日新增用户数*100%。 3.计算近30日的用户平均留存率Ya:(1)将近30日的“用户留存率Y”相加,得到近30日用户留存率总和。(2)近30日用户平均留存率Ya=近30日用户留存率总和/30。(3)“近30日”包含本日数据。 4.P值计算与分析:(1)计算P值:P值=近30日用户平均留存率Ya-用户留存率Y。(2)对P值进行分析:若P值大于0,则说明留存用户比例较低;若P值小于0,则说明留存用户比例较高;若P值等于0,则说明留存用户比例稳定。 5.用户留存状态判定:若P值连续5日大于0或近10日中超过6次大于0,则判定为“用户留存状态异常,需尽快分析问题,采取措施,提高用户留存率”;反之则判定为“留存状态正常”。
The application scenarios of this dataset are as follows: (1) Risk early warning and response: The user retention status analysis results can be used as a risk management tool to help companies proactively identify potential user churn risks in asset management systems and take intervention measures to reduce user churn. (2) Investment decision-making: The user retention rate can reveal the market competitiveness and development prospects of the product. Investors can refer to this dataset to evaluate the market performance and growth potential of the asset management service industry, and make informed investment decisions. (3) User behavior understanding: This dataset provides quantitative data on user retention behaviors in asset management systems, helping enterprises developing similar systems understand the user retention behavior patterns during product usage. (4) Industry trend analysis: For the entire asset management service industry, the user retention analysis results of this system can serve as an important reference for market trend analysis and prediction. 1. Data collection and preprocessing: (1) Collect user new registration and activity data from the logs of the company's operating asset management system. The data fields include analysis date, number of newly added users yesterday, and the number of newly added users yesterday who remained active today. (2) Clean the collected data, check and remove abnormal data points. 2. Calculate user retention rate Y: User retention rate Y = (Number of newly added users yesterday who remained active today / Number of newly added users yesterday) * 100%. 3. Calculate the 30-day average user retention rate Ya: (1) Sum the "user retention rate Y" of the past 30 days to obtain the total 30-day user retention rate. (2) 30-day average user retention rate Ya = Total 30-day user retention rate / 30. (3) The "past 30 days" includes today's data. 4. P-value calculation and analysis: (1) Calculate the P-value: P-value = 30-day average user retention rate Ya - user retention rate Y. (2) Analyze the P-value: If the P-value is greater than 0, it means the proportion of retained users is relatively low; if the P-value is less than 0, it means the proportion of retained users is relatively high; if the P-value is equal to 0, it means the proportion of retained users is stable. 5. User retention status determination: If the P-value is greater than 0 for 5 consecutive days or more than 6 times in the past 10 days, it is determined as "User retention status is abnormal, please analyze the problem as soon as possible and take measures to improve the user retention rate"; otherwise, it is determined as "Retention status is normal".