黑河生态水文遥感试验:水文气象观测网数据集(胡杨林站涡动相关仪-2013)
收藏国家青藏高原科学数据中心2021-04-19 更新2024-03-01 收录
下载链接:
https://data.tpdc.ac.cn/zh-hans/data/9b860b65-ecd9-43df-b2cf-5f1276ab3805
下载链接
链接失效反馈官方服务:
资源简介:
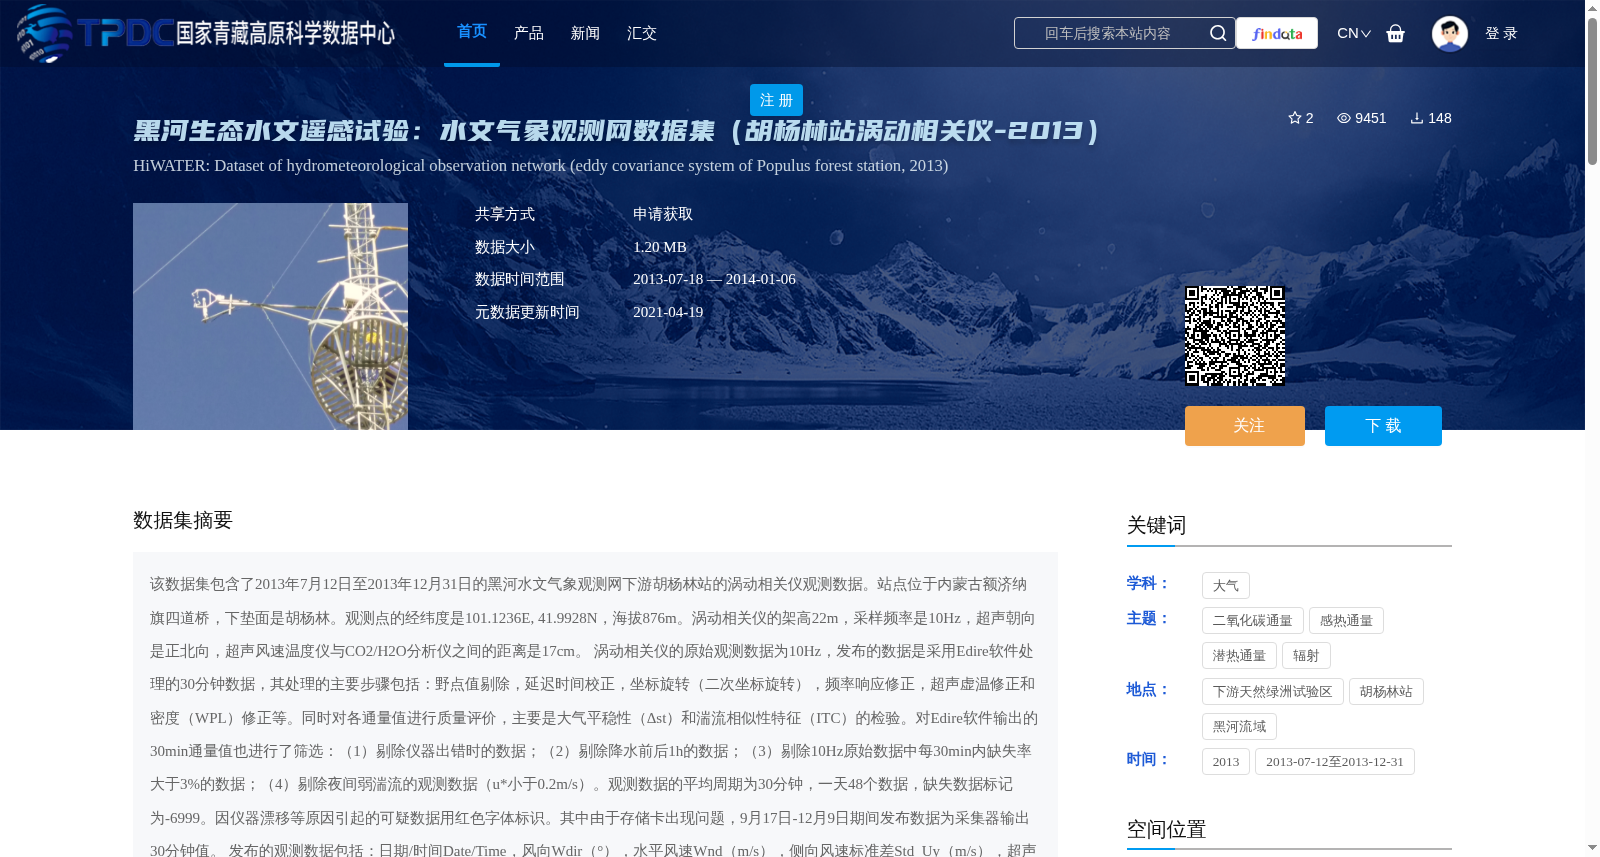
该数据集包含了2013年7月12日至2013年12月31日的黑河水文气象观测网下游胡杨林站的涡动相关仪观测数据。站点位于内蒙古额济纳旗四道桥,下垫面是胡杨林。观测点的经纬度是101.1236E, 41.9928N,海拔876m。涡动相关仪的架高22m,采样频率是10Hz,超声朝向是正北向,超声风速温度仪与CO2/H2O分析仪之间的距离是17cm。
涡动相关仪的原始观测数据为10Hz,发布的数据是采用Edire软件处理的30分钟数据,其处理的主要步骤包括:野点值剔除,延迟时间校正,坐标旋转(二次坐标旋转),频率响应修正,超声虚温修正和密度(WPL)修正等。同时对各通量值进行质量评价,主要是大气平稳性(Δst)和湍流相似性特征(ITC)的检验。对Edire软件输出的30min通量值也进行了筛选:(1)剔除仪器出错时的数据;(2)剔除降水前后1h的数据;(3)剔除10Hz原始数据中每30min内缺失率大于3%的数据;(4)剔除夜间弱湍流的观测数据(u*小于0.2m/s)。观测数据的平均周期为30分钟,一天48个数据,缺失数据标记为-6999。因仪器漂移等原因引起的可疑数据用红色字体标识。其中由于存储卡出现问题,9月17日-12月9日期间发布数据为采集器输出30分钟值。
发布的观测数据包括:日期/时间Date/Time,风向Wdir(°),水平风速Wnd(m/s),侧向风速标准差Std_Uy(m/s),超声虚温Tv(℃),水汽密度H2O(g/m3),二氧化碳浓度CO2(mg/m3),摩擦速度Ustar(m/s),稳定度Z/L(无量纲),感热通量Hs(W/m2),潜热通量LE(W/m2),二氧化碳通量Fc(mg/(m2s)),感热通量的质量标识QA_Hs,潜热通量的质量标识QA_LE,二氧化碳通量的质量标识QA_Fc。感热、潜热、二氧化碳通量的质量标识分为三级(质量标识0:(Δst <30, ITC<30); 1: (Δst <100, ITC<100); 其余为2)。数据时间的含义,如0:30代表0:00-0:30的平均;数据以*.xls格式存储。
水文气象网或站点信息请参考Li et al. (2013),观测数据处理请参考Liu et al.(2011)。
This dataset contains eddy covariance observational data collected at the Populus euphratica Forest Station, a downstream site of the Heihe Hydrometeorological Observation Network, spanning from July 12, 2013 to December 31, 2013. The station is situated at Sidaoqiao, Ejina Banner, Inner Mongolia, with its underlying surface covered by natural Populus euphratica forests. The geographic coordinates of the observation site are 101.1236°E and 41.9928°N, with an elevation of 876 meters. The eddy covariance system is installed at a height of 22 m, with a sampling frequency of 10 Hz. The ultrasonic anemometer is oriented toward true north, and the separation distance between the ultrasonic anemometer and the CO2/H2O analyzer is 17 cm.
The raw observational data from the eddy covariance system is recorded at 10 Hz, while the publicly released dataset consists of 30-minute averaged data processed using the Edire software. The core processing steps include outlier removal, time lag correction, double coordinate rotation, frequency response correction, ultrasonic virtual temperature correction, and Webb-Pearman-Leuning (WPL) density correction. Quality assessments were subsequently conducted for all flux products, primarily involving tests for atmospheric stationarity (Δst) and turbulence similarity criterion (ITC). Additional screening was applied to the 30-minute flux outputs generated by Edire software: (1) Exclude data collected during instrument failures; (2) Exclude data within 1 hour prior to and following precipitation events; (3) Exclude data with a missing rate exceeding 3% within each 30-minute window from the original 10 Hz dataset; (4) Exclude nighttime weak turbulence observations where the friction velocity u* is less than 0.2 m/s. The observational data have an average period of 30 minutes, yielding 48 data points per day. Missing data are marked with -6999. Suspicious data induced by instrument drift and other anomalies are labeled in red font. Owing to a memory card malfunction, the released data from September 17 to December 9 are the 30-minute values directly output by the data logger.
The released observational dataset includes the following variables: Date/Time, wind direction (Wdir, °), horizontal wind speed (Wnd, m/s), lateral wind speed standard deviation (Std_Uy, m/s), ultrasonic virtual temperature (Tv, ℃), water vapor density (H2O, g/m³), carbon dioxide concentration (CO2, mg/m³), friction velocity (Ustar, m/s), stability parameter Z/L (dimensionless), sensible heat flux (Hs, W/m²), latent heat flux (LE, W/m²), carbon dioxide flux (Fc, mg/(m²s)), quality flag of sensible heat flux (QA_Hs), quality flag of latent heat flux (QA_LE), and quality flag of carbon dioxide flux (QA_Fc). The quality flags for sensible heat, latent heat, and carbon dioxide fluxes are categorized into three levels: Flag 0 corresponds to (Δst < 30, ITC < 30); Flag 1 corresponds to (Δst < 100, ITC < 100); all other cases are classified as Flag 2. The meaning of the data timestamp is as follows: for example, 0:30 represents the average value over the period 0:00–0:30. All data are stored in *.xls format.
For detailed information on the hydrometeorological network and the study site, please refer to Li et al. (2013). For the data processing procedures, please refer to Liu et al. (2011).
提供机构:
刘绍民,李新,车涛,徐自为,任志国,谭俊磊
创建时间:
2016-07-08
搜集汇总
数据集介绍
背景与挑战
背景概述
该数据集包含2013年7月12日至12月31日黑河流域下游胡杨林站的涡动相关仪观测数据,站点位于内蒙古额济纳旗,下垫面为胡杨林,观测了感热通量、潜热通量和二氧化碳通量等关键水文气象变量。数据经过Edire软件处理和质量控制,以30分钟为平均周期发布,适用于生态水文过程研究。
以上内容由遇见数据集搜集并总结生成


