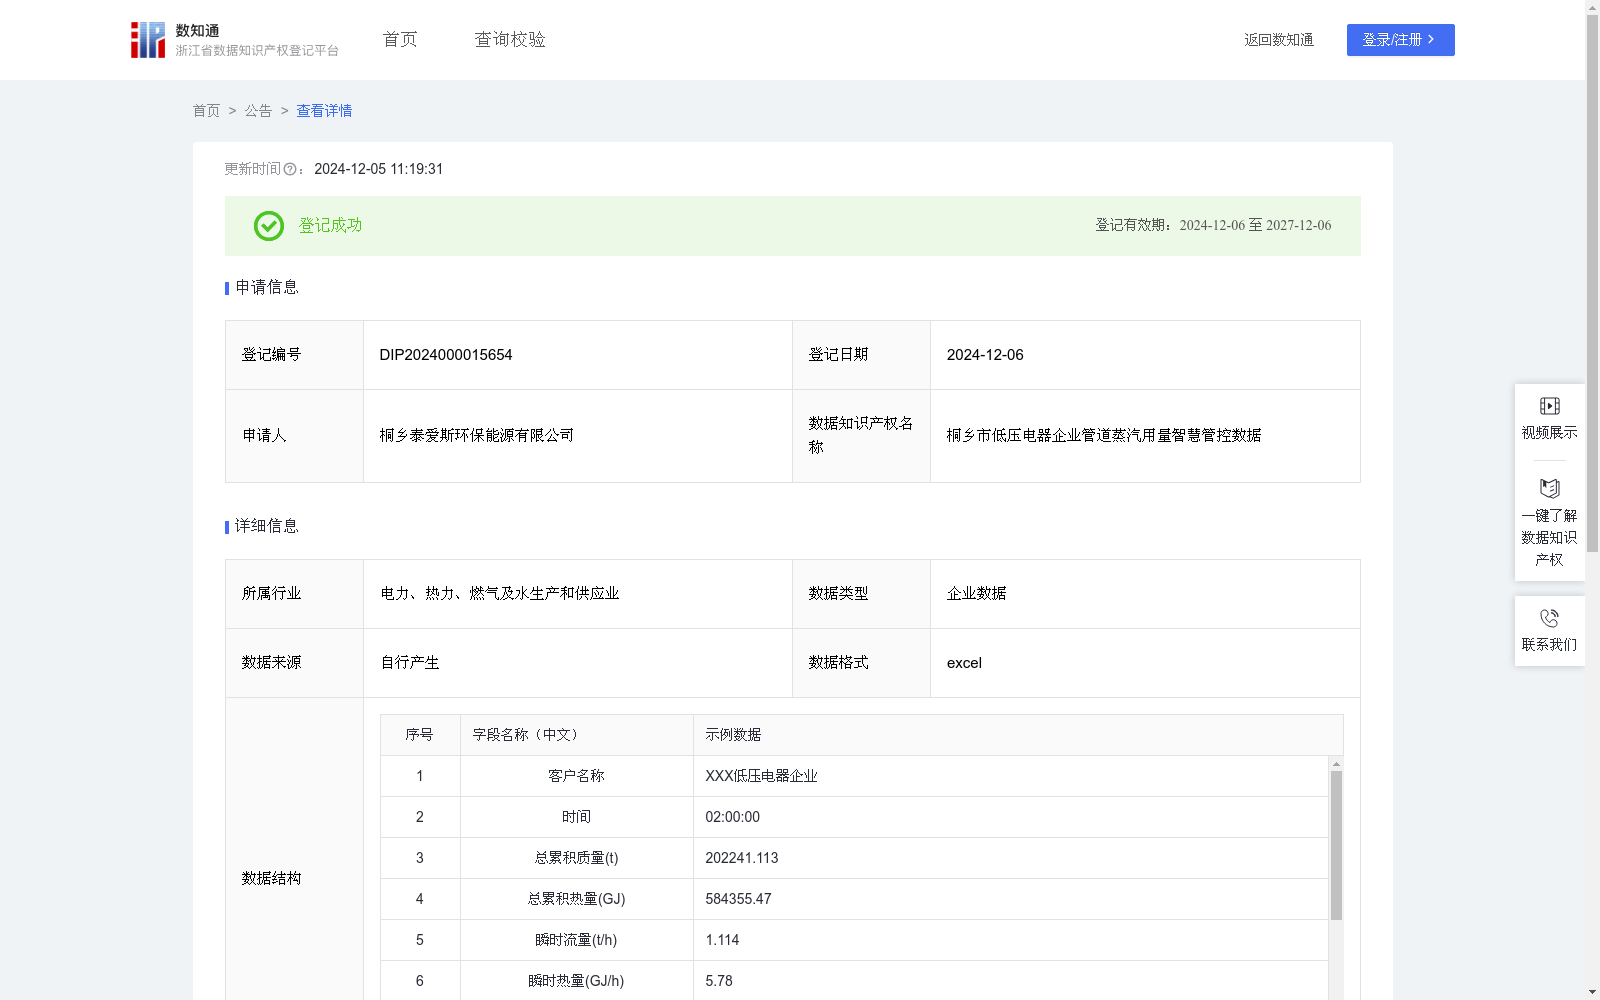
桐乡市低压电器企业管道蒸汽用量智慧管控数据
收藏浙江省数据知识产权登记平台2024-12-05 更新2024-12-06 收录
下载链接:
https://www.zjip.org.cn/home/announce/trends/96684
下载链接
链接失效反馈官方服务:
资源简介:
通过收集和分析低压电器企业管道蒸汽用量的时间、总累积质量、总累积热量、瞬时流量、瞬时热量、瞬时温度、瞬时压力、密度、输入电流等相关数据,了解低压电器行业对用热量的需求,以及对客户的用热量影响分析,能够更准确地预测其生产过程中的用热量,以便更好地进行能源管理和成本控制,利于低压电器类企业自我管控。将该模型应用于低压电器企业实际生产中,每天根据当天的生产计划和设备运行参数,预测当天的蒸汽用量。企业可以根据预测结果合理安排能源供应,优化生产调度,降低能源成本。同时,通过对蒸汽用量的实时监测和分析,及时发现能源浪费和管道故障等问题,提高能源利用效率和生产效益,实现绿色生产,对低压电器业类的企业生产过程有指导作用。科研机构可以利用低压电器企业的管道蒸汽用量智慧管控数据,开展能源管理技术的研究和创新。通过对大量数据的分析和挖掘,科研机构可以深入了解低压电器企业的蒸汽用量规律和节能潜力,研发出针对低压电器行业的能源管理技术和设备。选用卷积神经网络模型进行构建。步骤1:数据进行收集处理,整理为一个形状为(n_samples, 9)的numpy数组,管道蒸汽用量的时间、总累积质量、总累积热量、瞬时流量、瞬时热量、瞬时温度、瞬时压力、密度、输入电流分别为9个特征,再进行标准化处理,使得每个特征的均值为0,标准差为1。步骤2:利用python创建模型,添加一维卷积层、最大池化层,添加第二个卷积层、最大池化层,将卷积层的输出展平,添加全连接层,最后添加输出层,模型核心为使用一维卷积层来提取特征,然后通过最大池化层降低特征维度,将卷积层的输出展平后连接全连接层,最后输出一个预测值。步骤3:对模型进行编译,划分训练集、验证集和测试集,最后对输入数据进行形状调整,以适应卷积层的输入要求,再训练该模型。步骤4:测试和评估模型性能,绘制训练和验证损失曲线,观察训练过程,防止过拟合。步骤5:卷积神经网络模型输出预测蒸汽流量值和最高临界值为25.18t/h,当预测蒸汽流量值>25.18/h,管道状态显示“管道异常”,当0≤预测蒸汽流量值≤25.18t/h,显示“管道正常”。
By collecting and analyzing relevant data including timestamp, total cumulative mass, total cumulative heat, instantaneous flow rate, instantaneous heat, instantaneous temperature, instantaneous pressure, density, and input current of pipeline steam consumption for low-voltage electrical apparatus enterprises, we can understand the heat demand of the low-voltage electrical apparatus industry and analyze the impact on customers' heat consumption, so as to more accurately predict the heat consumption in their production processes, better conduct energy management and cost control, and facilitate the self-management of low-voltage electrical apparatus enterprises.
Applying this model to the actual production of low-voltage electrical apparatus enterprises, the daily steam consumption can be predicted based on the day's production plan and equipment operating parameters. Enterprises can reasonably arrange energy supply, optimize production scheduling, and reduce energy costs according to the prediction results. At the same time, through real-time monitoring and analysis of steam consumption, problems such as energy waste and pipeline faults can be detected in time, improving energy utilization efficiency and production benefits, realizing green production, and providing guidance for the production processes of low-voltage electrical apparatus enterprises.
Research institutions can use the intelligent management and control data of pipeline steam consumption of low-voltage electrical apparatus enterprises to carry out research and innovation of energy management technologies. Through the analysis and mining of a large amount of data, research institutions can deeply understand the steam consumption rules and energy-saving potential of low-voltage electrical apparatus enterprises, and develop energy management technologies and equipment targeting the low-voltage electrical apparatus industry.
The Convolutional Neural Network (CNN) model is selected for construction. Step 1: Collect and process the data, and organize them into a NumPy array with the shape of (n_samples, 9). The 9 features are timestamp, total cumulative mass, total cumulative heat, instantaneous flow rate, instantaneous heat, instantaneous temperature, instantaneous pressure, density, and input current of pipeline steam consumption, respectively. Then perform standardization such that each feature has a mean of 0 and a standard deviation of 1.
Step 2: Create the model in Python, add a 1D convolutional layer and a max pooling layer, then add a second convolutional layer and a max pooling layer, flatten the output of the convolutional layers, add a fully connected layer, and finally add an output layer. The core of the model is to use 1D convolutional layers to extract features, then reduce the feature dimension via the max pooling layer, flatten the output of the convolutional layers, connect to the fully connected layer, and finally output a predicted value.
Step 3: Compile the model, split the dataset into training, validation, and test sets, adjust the shape of the input data to meet the input requirements of the convolutional layers, and then train the model.
Step 4: Test and evaluate the model performance, plot the training and validation loss curves, observe the training process, and prevent overfitting.
Step 5: The CNN model outputs the predicted steam flow value, with the maximum critical value set as 25.18 t/h. When the predicted steam flow value > 25.18 t/h, the pipeline status is marked as "Pipeline Abnormal"; when 0 ≤ predicted steam flow value ≤ 25.18 t/h, the pipeline status is marked as "Pipeline Normal".
提供机构:
桐乡泰爱斯环保能源有限公司
创建时间:
2024-11-14
搜集汇总
数据集介绍
以上内容由遇见数据集搜集并总结生成


