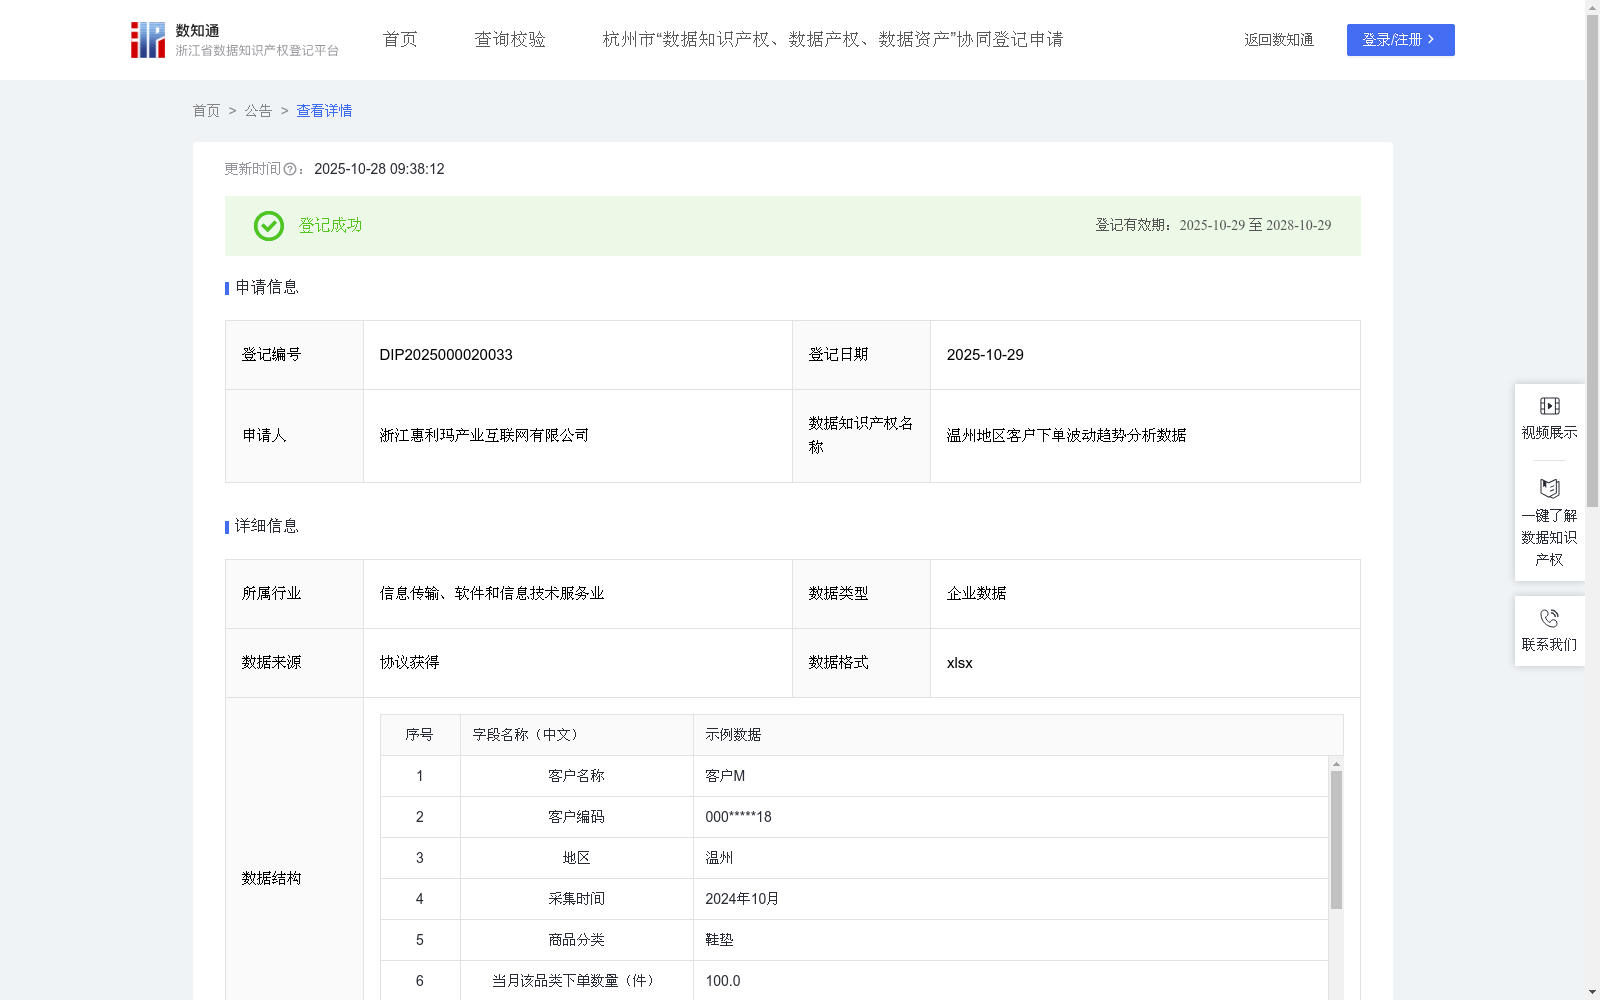
温州地区客户下单波动趋势分析数据
收藏资源简介:
采集通过软件系统下单的订单及客户数据,收集和分析近一年中,温州地区客户在每个月份针对各品类的下单数量及下单金额情况,并按月进行数据环比,从而得出该地区客户下单情况的汇总数据。下单数量和金额的波动能够敏锐地反映出市场需求的变化,帮助企业精准识别销售高峰期和低谷期,深入了解消费者的行为模式。基于对这些数据的进一步分析,企业能够更有效地开展库存管理、制定营销策略以及预测未来销售趋势,进而更好地适应市场变化,提升决策水平,实现可持续发展。举例如下: 剧烈波动(波动≥±5):表明市场需求发生大变化,需采取行动。在库存管理上,迅速响应,对需求激增的品类启动采购机制,确保不缺货;对需求骤减的品类调整生产计划,减少库存生产,考虑通过促销方式清理库存。营销策略则要调整市场定位和推广策略,重新审视目标客户群体,推出活动,以适应市场变化。同时加强与客户沟通,了解需求变化,及时调整产品和服务。 上月无下单 迅速回访了解原因。若因竞争,推优惠、提质量抢回客户。库存上,减少常购品类备货,依其他客户销售灵活调整。 相对稳定(波动<±0.2) 按过往销售精准库存管理,维持营销推广,培养客户忠诚度。1、数据采集:采集数据来源为通过软件系统进行下单的订单及客户数据,如商品信息,商品分类,下单数量,下单金额等, 2、数据处理,对采集到的数据根据品类和月份进行分类,合并,累加,便于分析使用。 3、算法加工:首先将上月各个品类下单数量和下单金额为0的数据归类为“上月未下单”,下单数量月环比,下单金额月环比和综合波动趋势均为0,其余数据:将处理后的数据进行下单数量的月环比HA以及下单金额的月环比HM, HA=(当月各个品类下单数量-上月各个品类下单数量)/上月各个品类下单数量; HM=(当月各个品类下单金额-上月各个品类下单金额)/上月各个品类下单金额; 根据数量和金额的与环比,综合得出客户该月在各个品类下的下单综合波动趋势HZ=HA*0.4+HM*0.6,。最后根据综合波动趋势对客户下单情况进行分级 ; 4、数据分类分级:根据综合波动比判断用户下单的波动情况,如“上月各个品类下单数量”为0的为“上月无下单”,上月有下单数量且波动趋势<±0.2的为“相对稳定”,上月有下单数量且±0.2≤波动趋势<±1的为“轻微波动,观察”,上月有下单数量且±1≤波动趋势<±5的为“有明显波动,定期跟进”,上月有下单数量且±5≤波动趋势的为“剧烈波动,马上跟进”。 5、后续处理:每月根据单月的下单波动情况,定期对客户进行回放跟进,及时调整营销策略,活动方向,以及对应的库存备货情况,后续继续追踪当月的调整后波动的变化情况,可持续的优化营销模式的等,帮助企业更好的了解消费者行为并动态的优化战略,实现可持续发展和提升。
This dataset collects order and customer data generated through software-based order placement systems. It gathers and analyzes the monthly order volume and order amount for each product category from customers in Wenzhou over the past year, performs month-over-month (MoM) comparisons of the data, and generates aggregated insights into the ordering behaviors of local customers. Fluctuations in order volume and amount can sensitively reflect shifts in market demand, enabling enterprises to accurately identify sales peaks and troughs, and gain in-depth understanding of consumer behavior patterns. Through further analysis of this dataset, enterprises can conduct more efficient inventory management, develop targeted marketing strategies, and forecast future sales trends, thereby better adapting to market changes, enhancing decision-making capabilities, and achieving sustainable development. Examples are as follows: 1. Severe Fluctuation (fluctuation ≥ ±5): Indicates a significant change in market demand, requiring immediate action. For inventory management: respond rapidly, activate procurement procedures for product categories with surging demand to avoid stockouts; adjust production plans for categories with plummeting demand, reduce inventory-based production, and consider clearing excess inventory through promotions. For marketing strategies: adjust market positioning and promotion tactics, re-evaluate target customer groups, and launch targeted campaigns to adapt to market changes. Meanwhile, strengthen communication with customers to understand demand shifts and timely adjust products and services. 2. No Orders in Previous Month: Conduct prompt follow-up calls to identify the underlying reasons. If the loss of customers is due to competition, offer preferential policies and improve product quality to win back clients. For inventory management: reduce stock reserves of frequently-purchased product categories and flexibly adjust based on sales data of other customers. 3. Relatively Stable (fluctuation < ±0.2): Implement precise inventory management based on historical sales data, maintain existing marketing promotions, and foster customer loyalty. The dataset construction process includes the following 5 steps: 1. Data Collection: Source data covers order and customer data generated via software-based order placement, including product information, product categories, order volume, order amount, and other related metrics. 2. Data Processing: Classify, merge, and aggregate the collected data by product category and month to facilitate subsequent analysis. 3. Algorithm Processing: First, classify data where the order volume and order amount for each category in the previous month are 0 as "No Orders in Previous Month", with their MoM order volume change, MoM order amount change, and comprehensive fluctuation trend all set to 0. For the remaining data: - Calculate the MoM change rate of order volume (HA): HA = (Current month order volume per category - Previous month order volume per category) / Previous month order volume per category - Calculate the MoM change rate of order amount (HM): HM = (Current month order amount per category - Previous month order amount per category) / Previous month order amount per category - Derive the comprehensive fluctuation trend (HZ) for each category's orders per customer using the weighted formula: HZ = 0.4*HA + 0.6*HM, based on the MoM changes of order volume and amount. Finally, grade the customer ordering behaviors according to the calculated comprehensive fluctuation trend. 4. Data Classification and Grading: Determine the fluctuation status of customer orders based on the comprehensive fluctuation ratio: - "No Orders in Previous Month": Order volume for each category in the previous month is 0 - "Relatively Stable": Previous month order volume exists and fluctuation trend < ±0.2 - "Minor Fluctuation, Monitor": Previous month order volume exists and ±0.2 ≤ fluctuation trend < ±1 - "Obvious Fluctuation, Regular Follow-up": Previous month order volume exists and ±1 ≤ fluctuation trend < ±5 - "Severe Fluctuation, Immediate Follow-up": Previous month order volume exists and fluctuation trend ≥ ±5 5. Post-processing: Each month, conduct regular follow-up communications with customers based on the monthly order fluctuation status, timely adjust marketing strategies, campaign directions, and corresponding inventory stock levels. Subsequently, continue tracking changes in post-adjustment fluctuations of the current month, and continuously optimize marketing models and other aspects, helping enterprises better understand consumer behaviors and dynamically optimize strategies to achieve sustainable development and performance improvement.