医院神经手术用耗分析数据
收藏资源简介:
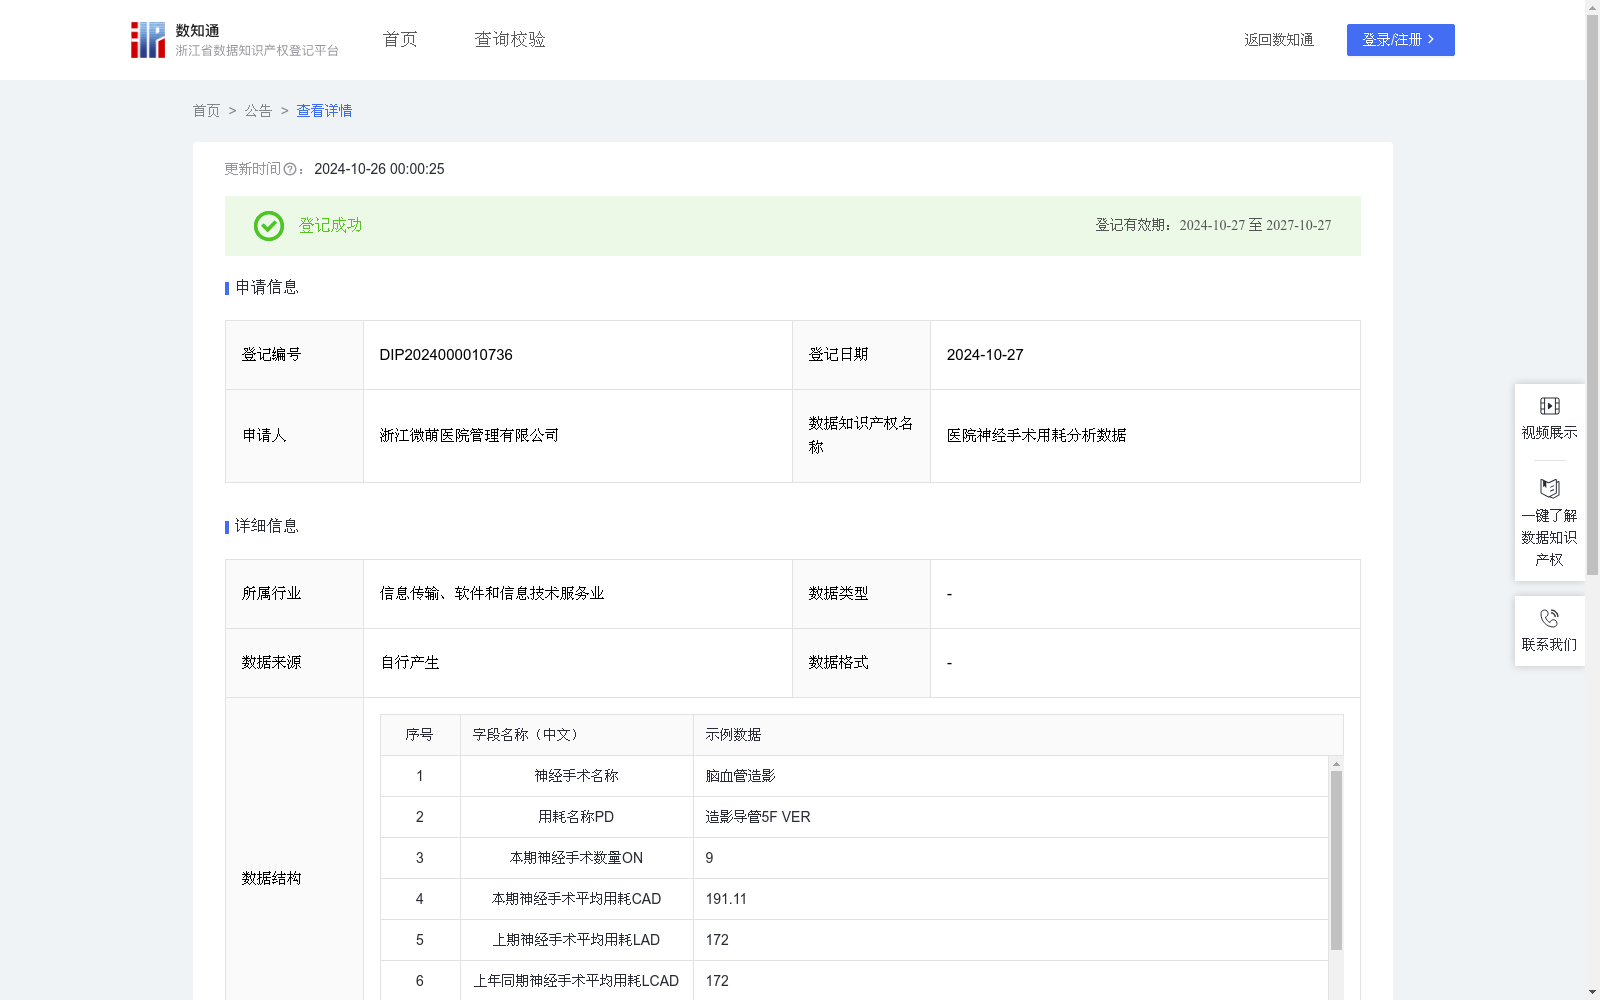
在医院神经手术用耗分析场景中,通过对医院的神经手术用耗金额与时间维度的挖掘,生成的数据可作为模型辅助医院监管人员对医院神经手术用耗的异常波动分析.从而分析神经手术用耗详情的变化与平均用耗的关系.以此来管控神经手术用耗异常波动.1:数据来源: 采集XX医院SPD系统每月神经手术用耗使用数据 2: 数据处理: 本期神经手术数量ON:本月该神经手术数量; 用耗名称PD:手术用耗名称; 本期神经手术平均用耗CAD: 本月该神经手术金额的平均值 ; 上期神经手术平均用耗LAD: 上月该神经手术金额的平均值 ; 上年同期神经手术平均用耗LCAD:上年同期该神经手术金额的平均值 ; 3:算法分析: 采用公式计算该神经手术平均用耗环比增长率OPCAR= (CAD/LAD-1) x100%; 采用公式计算该神经手术用耗同比增长率OPYAR= (CAD / LCAD-1) x100%; 4:数据应用: 在医院神经手术用耗场景中,该神经手术用耗环比增长率OPCAR( 小于-30%,该神经手术平均用耗异常,(-30% 30%),正常浮动范围, 大于30%该神经手术平均用耗异常 ); 该神经手术用耗环比增长率OPYAR( 小于-30%,该神经手术平均用耗异常,(-30% ,30%),正常浮动范围, 大于30%该神经手术平均用耗异常 );
In the scenario of neurosurgical supply consumption analysis in hospitals, the data generated by mining the neurosurgical supply consumption amounts and time dimensions of hospitals can be used by models to assist hospital supervisors in analyzing abnormal fluctuations of neurosurgical supply consumption, so as to explore the relationship between changes in neurosurgical supply consumption details and average consumption, and thus control abnormal fluctuations in neurosurgical supply consumption. 1. Data Source: Monthly neurosurgical supply consumption data is collected from the SPD system of XX Hospital. 2. Data Processing: - Number of current-period neurosurgeries ON: The number of neurosurgeries conducted this month; - Supply Name PD: Name of surgical supplies used; - Average Neurosurgical Consumption (Current Period) CAD: Average consumption amount of the neurosurgery this month; - Average Neurosurgical Consumption (Last Period) LAD: Average consumption amount of the neurosurgery last month; - Average Neurosurgical Consumption (Same Period of Last Year) LCAD: Average consumption amount of the neurosurgery in the same period of last year; 3. Algorithm Analysis: Calculate the month-on-month growth rate of neurosurgical supply consumption OPCAR using the formula: OPCAR = (CAD / LAD - 1) × 100%; Calculate the year-on-year growth rate of neurosurgical supply consumption OPYAR using the formula: OPYAR = (CAD / LCAD - 1) × 100%; 4. Data Application: In the hospital neurosurgical supply consumption scenario, for the month-on-month growth rate OPCAR of neurosurgical supply consumption: less than -30% indicates abnormal average consumption of the neurosurgery; the range (-30%, 30%) is the normal fluctuation interval; greater than 30% indicates abnormal average consumption of the neurosurgery; For the year-on-year growth rate OPYAR of neurosurgical supply consumption: less than -30% indicates abnormal average consumption of the neurosurgery; the range (-30%, 30%) is the normal fluctuation interval; greater than 30% indicates abnormal average consumption of the neurosurgery;