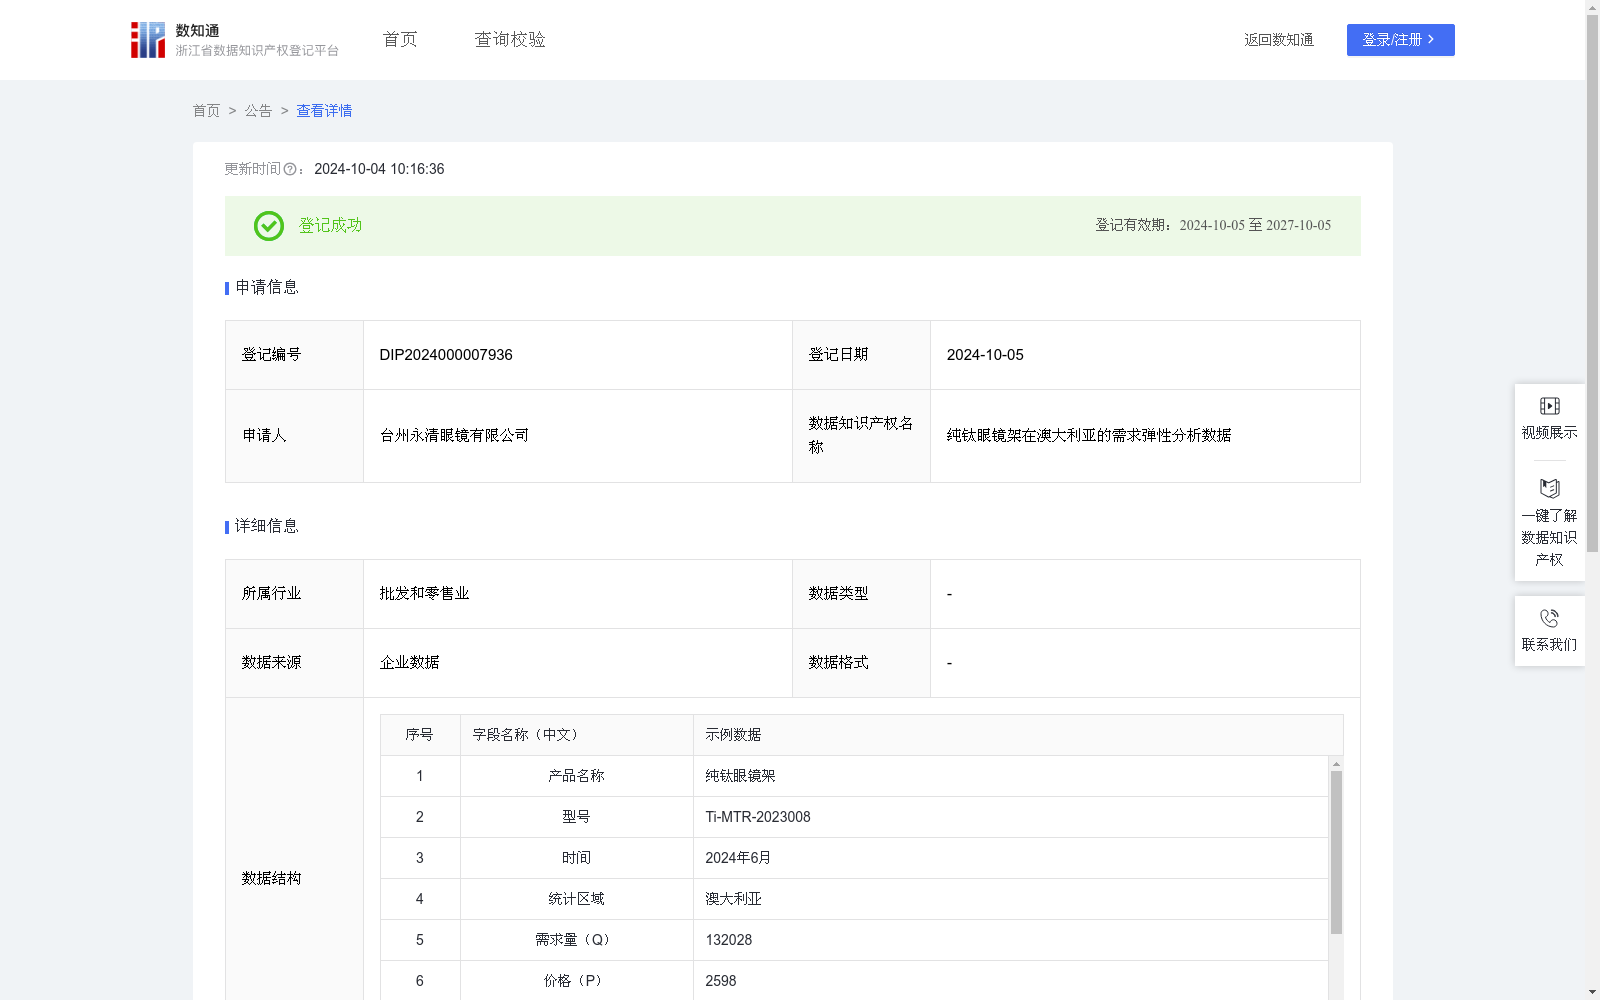
纯钛眼镜架在澳大利亚的需求弹性分析数据
收藏资源简介:
我市眼镜行业在全球市场拥有极高的市场份额,为更好了解不同海外市场对纯钛眼镜架产品外贸出口的市场需求情况,需要对纯钛眼镜架产品在不同地区的需求弹性进行数据分析。眼镜行业的所有外贸企业都可以根据本数据分析的结果制定营销策略。若产品需求富有弹性,可以适当降低产品价格来提高销量、抢占市场;若产品需求缺乏弹性,则可以适当提高产品价格来提高利润率,打造高端品牌效应。该项数据对眼镜行业外贸企业在海外市场的资源配置及市场布局相关决策具有重要参考价值。1.数据采集:采集纯钛眼镜架产品在相关地区的需求数据和价格数据,在系统内进行同比分析,得到产品的需求量变动数值和价格变化数值。 2.数据运算:根据运算公式 需求弹性系数Ed=-(△Q/Q)÷(△P/P),可得到需求弹性系数。式中:Q表示产品的需求量,单位为份;P表示产品的价格,单位为元(按人民币记);△Q表示产品的需求量同比变动值,单位为份;△P表示产品的价格同比变动值,单位为元(按人民币记)。取需求弹性系数的绝对值|Ed|作为分析数据时的参考系数。 3.数据分析:根据|Ed|的数值可分析该产品的需求价格弹性。(1)|Ed|=1(单位需求价格弹性),说明需求量变动幅度与价格变动幅度相同;(2)1<|Ed|<∝(需求富有弹性),说明需求量变动幅度大于价格变动幅度;(3)0<|Ed|<1(需求缺乏弹性),说明需求量变动幅度小于价格变动幅度;(4)|Ed|→0(需求完全无弹性),这表示不管价格怎样变动,需求量总是固定不变;(5)|Ed|→∝(需求完全有弹性),表示在既定价格之下,需求量可以任意变动。
The eyeglass industry in our city holds a dominant global market share. To gain a better understanding of the market demand for pure titanium eyeglass frame products in overseas foreign trade exports across different regions, it is necessary to conduct data analysis on the demand elasticity of pure titanium eyeglass frame products in various overseas markets. All foreign trade enterprises in the local eyeglass industry can develop targeted marketing strategies based on the findings of this data analysis. If the product demand is elastic, appropriately lowering the product price can help increase sales volume and seize larger market share; if the product demand is inelastic, appropriately raising the product price can improve profit margins and foster a high-end brand effect. This data provides critical reference value for foreign trade enterprises in the eyeglass industry when making decisions related to overseas market resource allocation and market layout. 1. Data Collection: Collect demand and price data of pure titanium eyeglass frame products in relevant regions, and conduct year-on-year analysis within the system to derive the product demand change value and price change value. 2. Data Calculation: The demand elasticity coefficient Ed can be calculated using the following formula: $Ed = -(ΔQ/Q) ÷ (ΔP/P)$. In this formula: Q denotes the product demand, with the unit of unit; P denotes the product price, denominated in RMB (yuan); ΔQ represents the year-on-year change in product demand, with the unit of unit; ΔP represents the year-on-year change in product price, denominated in RMB (yuan). The absolute value |Ed| of the demand elasticity coefficient is taken as the reference coefficient for data analysis. 3. Data Analysis: The price elasticity of demand for this product can be analyzed based on the value of |Ed|. (1) |Ed|=1 (Unitary Price Elasticity of Demand): Indicates that the magnitude of demand change is consistent with that of price change; (2) 1<|Ed|<∞ (Elastic Demand): Indicates that the magnitude of demand change is greater than that of price change; (3) 0<|Ed|<1 (Inelastic Demand): Indicates that the magnitude of demand change is less than that of price change; (4) |Ed|→0 (Perfectly Inelastic Demand): This means that regardless of price fluctuations, the product demand remains fixed; (5) |Ed|→∞ (Perfectly Elastic Demand): Indicates that demand can change arbitrarily at a given price level.