
Future Global Aridity Index and PET Database (CMIP_6)
收藏DataCite Commons2025-05-14 更新2025-05-18 收录
下载链接:
https://www.scidb.cn/detail?dataSetId=11e920c1ee144fc2a691951096b96cbc
下载链接
链接失效反馈官方服务:
资源简介:
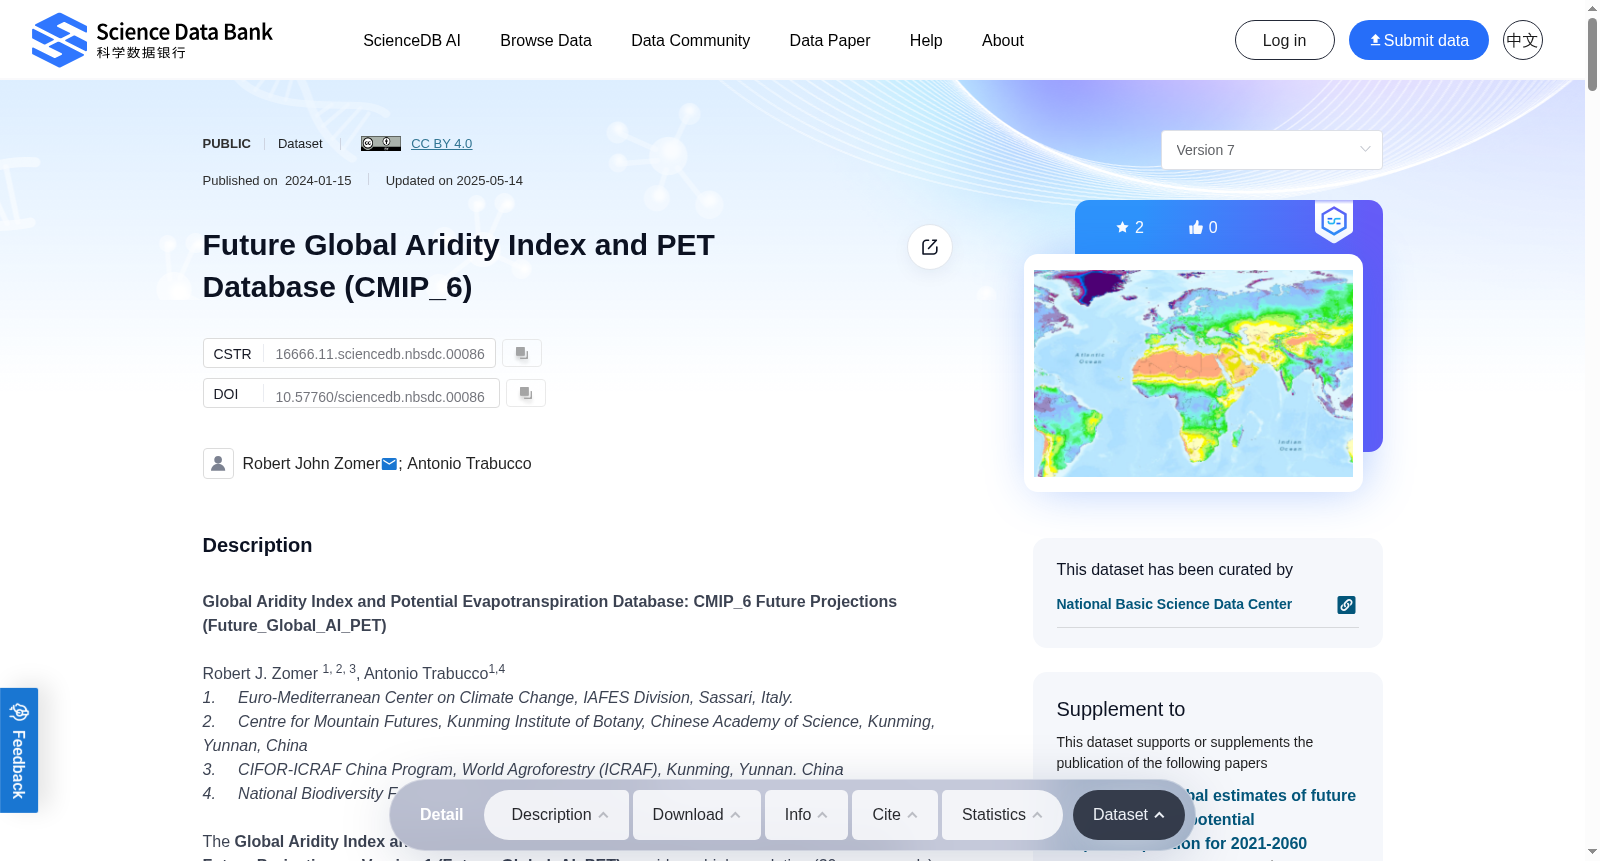
Global Aridity Index and Potential Evapotranspiration Database: CMIP_6 Future Projections(Future_Global_AI_PET)Robert J. Zomer 1, 2, 3, Antonio Trabucco1,41. Euro-Mediterranean Center on Climate Change, IAFES Division, Sassari, Italy. 2. Centre for Mountain Futures, Kunming Institute of Botany, Chinese Academy of Science, Kunming, Yunnan, China3. CIFOR-ICRAF China Program, World Agroforestry (ICRAF), Kunming, Yunnan. China4. National Biodiversity Future Center (NBFC), Palermo, ItalyThe Global Aridity Index and Potential Evapotranspiration (Global AI-PET) Database: CMIP_6 Future Projections – Version 1 (Future_Global_AI_PET) provides a high-resolution (30 arc-seconds) global raster dataset of average monthly and annual potential evapotransipation (PET) and aridity index (AI) for two historical (1960-1990; 1970-2000) and two future (2021-2040; 2041-2060) time periods for each of 22 CMIP6 Earth System Models across four emission scenarios (SSP: 126, 245, 370, 585). The database also includes three averaged multi-model ensembles produced for each of the four emission scenarios:· All Models: includes all of the 22 ESM, as available within a particular SSP.· High Risk: includes 5 ESM identified as projecting the highest increases in temperature and precipitation and lying outside and significantly higher than the majority of estimates.· Majority Consensus: includes 15 ESM, that is, all available ESM excluding the ESM in the “High Risk” category, and those missing data across all of the 4 SSP. Further herein referred to as the “Consensus” category.These geo-spatial datasets have been produced with the support of Euro-Mediterranean Center on Climate Change, IAFES Division; Centre for Mountain Futures, Kunming Institute of Botany, Chinese Academy of Science; CIFOR-ICRAF China Program, World Agroforestry (CIFOR-ICRAF) and the National Biodiversity Future Center (NBFC).These datasets are provided under a CC_BY 4.0 License (please attribute), in standard GeoTiff format, WGS84 Geographic Coordinate System, 30 arc seconds or ~ 1km at the equator, to support studies contributing to sustainable development, biodiversity and environmental conservation, poverty alleviation, and adaption to climate change, among other global, regional, national, and local concerns.The Future_Global_AI_PET is available online from the Science Data Bank (ScienceDB) at: https://doi.org/10.57760/sciencedb.nbsdc.00086Previous versions of the Global Aridity Index and PET Database are available online here:https://figshare.com/articles/dataset/Global_Aridity_Index_and_Potential_Evapotranspiration_ET0_Climate_Database_v2/7504448/6Technical questions regarding the datasets can be directed to Robert Zomer: r.zomer@mac.com or Antonio Trabucco: antonio.trabucco@cmcc.it Methods:Based on the results of comparative validations, the Hargreaves model has been evaluated as one of the best fit to model PET and Aridity index globally with the available high resolution downscaled and bias corrected climate projections and chosen for the implementation of the Global-AI_PET- CMIP6 Future Projections. This method performs almost as well as the Penman-Monteith method, but requires less parameterization, and has significantly lower sensitivity to error in climatic inputs (Hargreaves and Allen, 2003). The currently available downscaled CMIP6 projections (available from WorldClim) do provide fewer climate variables idoneous for implementation of temperature-based evapotranspiration methods, such as the Hargreaves method. Hargreaves (1985, 1994) uses mean monthly temperature (Tmean), mean monthly temperature range (TD) and extraterrestrial radiation (RA, radiation on top of the atmosphere) to calculate ET0, as shown below: PET = 0.023 * RA * (Tmean + 17.8) * TD0.5where RA is extraterrestrial radiation at the top of the atmosphere, TD is the difference between mean maximum temperatures and mean minimum temperatures (Tmax - Tmin), and Tmean is equal to Tmax + Tmin divided by 2. The Hargreaves equation has been implemented globally on a per grid cell basis at 30 arc seconds resolution (~ 1km2 at the equator), in ArcGIS (v11.1) using Python v3.2 (see code availability section) to estimate PET/AI globally using future projections provided by the CMIP6 collaboration. The data to parametrize the equation were obtained from the Worldclim (worldclim.org) online data repository, which provides bias-corrected downscaled monthly values of minimum temperature, maximum temperature, and precipitation for 25 CMIP6 Earth System Models (ESMs), across four Shared Socio-economic Pathways (SSPs): 126, 245, 370 and 585. PET/AI was estimated for two historical periods, WorldClim 1.4 (1960-1990) and WorldClim 2.1 (1970-2000), representing on average a decades change, by applying the Hargreaves methodology described above. Similarly, PET/AI was estimated for two future time periods, namely 2021-2040 and 2041-2060, for each of the 25 models across their respective four SSP scenarios (126, 245, 370,585). Aridity Index Aridity is often expressed as an Aridity Index, comprised of the ratio of precipitation over PET, and signifying the amount of precipitation available in relation to atmospheric water demand and quantifying the water (from rainfall) availability for plant growth after ET demand has been met, comparing incoming moisture totals with potential outgoing moisture. The AI for the averaged time periods has been calculated on a per grid cell basis, as: AI = MA_Prec/MA_PETwhere: AI = Aridity Index MA_Prec = Mean Annual Precipitation MA_PET = Mean Annual Reference EvapotranspirationUsing the mean annual precipitation (MA_Prec) values obtained from the CMIP6 climate projections, while ET0 datasets estimated on a monthly average basis by the method described above were aggregated to mean annual values (MA_PET). Using this formulation, AI values are unitless, increasing with more humid condition and decreasing with more arid conditions.Multi-Model Averaged EnsemblesBased upon the distribution of the various scenarios along a gradient of their projected temperature and precipitation estimates for the each of the four SSP and two future time period, three multi-model ensembles, each articulated by their four respective SSPs, were identified. The three parameters of monthly minimum temperature, monthly maximum temperature and monthly precipitation for ESM’s included within each of these ensemble categories were averaged for each of their respective SSPs. These averaged parameters were then used to calculate the PET/AI as per the above methodology.Code Availablity:The algorithm and code in Python used to calculate PET and AI is available on Figshare at this link below:https://figshare.com/articles/software/Global_Future_PET_AI_Algorithm_Code_Python_-_Calculate_PET_AI/24978666DATA FORMATPET datasets are available as monthly averages (12 datasets, i.e. one dataset for each month, averaged over the specified time period) or as an annual average (1 dataset) for the specified time period. Aridity Index grid layers are available as one grid layer representing the annual average over the specified period. The following nomenclature is used to describe the dataset: Zipped Files - Directory Names refer to: Model_SSP_Time-PeriodFor example: ACCESS-CM2_126_2021-2040.zip Model: ACCESS-CM2 / SSP:126 / Time-Period: 2021-2040Prefix of Files (TIFFs) is either:pet_ for PET layers aridity_index for Aridity Index (no suffix)Suffix For PET Files is either:1, 2, ... 12 Month of the yearyr Yearly averagesd Standard DeviationExamples:pet_02.tif is the PET average for the month of February.pet_yr.tif is the PET annual average.’pet_sd.tif is the standard deviation of the annual PETaridity_index.tif is the annual aridity index. The PET values are defined as total mm of PET per month or per year. The Aridity Index values are unit-less.The geospatial dataset is in geographic coordinates; datum and spheroid are WGS84; spatial units are decimal degrees. The spatial resolution is 30 arc-seconds or 0.008333 degrees. Arc degrees and seconds are angular distances, and conversion to linear units (like km) varies with latitude, as below:The Future-PET and Future-Aridity Index data layers have been processed and finalized for distribution online as GEO-TIFFs. These datasets have been zipped (.zip) into monthly series or individual annual layers, by each combination of climate model/scenarios, and are available for online access. Data Storage HierarchyThe database is organized for storage into a hierarchy of directories (see ReadMe.doc):( Individual zipped files are generally about 1 GB or less) Associated Peer Reviewed Journal Article:Zomer RJ, Xu J, Spano D and Trabucco A. 2024. CMIP6-based global estimates of future aridity index and potential evapotranspiration for 2021-2060. Open Research Europe 4:157 https://doi.org/10.12688/openreseurope.18110.1For further info, please refer to these earlier paper describing the database and methodology:Zomer, R.J.; Xu, J.; Trabucco, A. 2022. Version 3 of the Global Aridity Index and Potential Evapotranspiration Database. Scientific Data 9, 409.Zomer, R. J; Bossio, D. A.; Trabucco, A.; van Straaten, O.; Verchot, L.V. 2008. Climate Change Mitigation: A Spatial Analysis of Global Land Suitability for Clean Development Mechanism Afforestation and Reforestation. Agric. Ecosystems and Environment. 126:67-80.Trabucco, A.; Zomer, R. J.; Bossio, D. A.; van Straaten, O.; Verchot, L.V. 2008. Climate Change Mitigation through Afforestation / Reforestation: A global analysis of hydrologic impacts with four case studies. Agric. Ecosystems and Environment. 126: 81-97.Zomer, R. J.; Trabucco, A.; van Straaten, O.; Bossio, D. A. 2006. Carbon, land and water: A global analysis of the hydrologic dimensions of climate change mitigation through afforestation/reforestation and the Kyoto Protocol Clean Development Mechanism. Colombo, Sri Lanka: International Water Management Institute. pp 48 . (IWMI Research Report 101).
提供机构:
Science Data Bank
创建时间:
2024-01-15
搜集汇总
数据集介绍
背景与挑战
背景概述
该数据集是一个高分辨率的全球潜在蒸散发和干旱指数数据库,覆盖历史和未来时期,基于CMIP6模型和多种排放情景,适用于气候变化和环境研究。
以上内容由遇见数据集搜集并总结生成



