2020年东南亚和南亚地区的10-30m分辨率水田数据集
收藏地球大数据科学工程2024-04-26 收录
下载链接:
https://data.casearth.cn/sdo/detail/65389524819aec0f260bc454
下载链接
链接失效反馈官方服务:
资源简介:
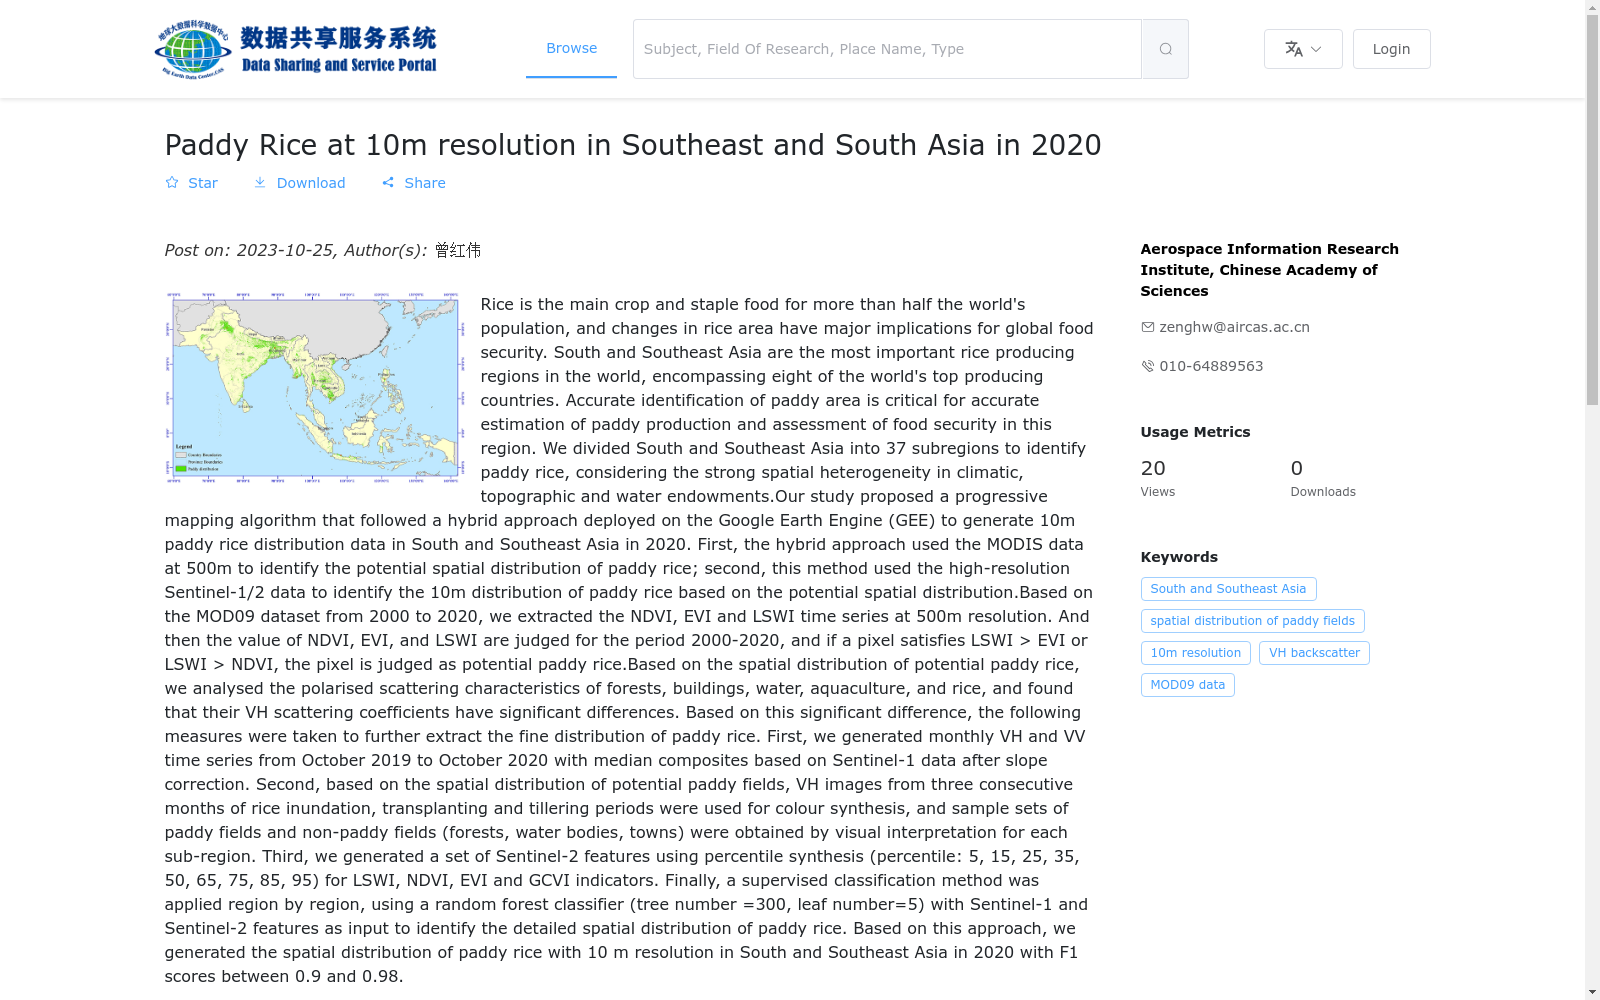
南亚与东南亚幅员辽阔,气候、地形和水资源禀赋的空间异质性强,精细分辨率水田制图难度极大,本研究将南亚和东南亚分为37个次区域来区分水稻。我们提出了一种渐进式的精细分辨率水稻提取方法,以提取2020年南亚和东南亚地区的10米分辨率水稻分布数据。首先,基于2000-2020年的500m分辨率的MOD09数据集,提取了NDVI、EVI和LSWI时间序列数据,然后对2000-2020年移栽-淹水期的NDVI、EVI和LSWI的值进行判断,如果像元满足LSWI>EVI或LSWI>NDVI,则该像素点为潜在水稻分布区;其次,根据潜在水稻的空间分布,采用水稻淹没期、插秧期和分蘖期连续三个月的VH影像进行彩色合成,通过目视解译得到各分区域的水田和非水田(森林、水体、城镇)样本集;最后,采用随机森林分类器(树数=300,叶数=5),以Sentinel-1的逐月VH特征和Sentinel-2的百分位特征作为输入,按照37个分区逐个开展监督分类,在潜在水稻空间分布的基础上,获取10米分辨率的水稻空间分布。上述水田识别的F1得分在0.9和0.98之间。
South and Southeast Asia are characterized by vast territory and strong spatial heterogeneity in climate, topography and water resource endowments, making high-resolution paddy field mapping extremely challenging. In this study, South and Southeast Asia are divided into 37 sub-regions to facilitate rice area differentiation. We propose a progressive high-resolution rice extraction method to derive 10-meter resolution rice distribution data for South and Southeast Asia in 2020. First, based on the 500-meter resolution MOD09 dataset from 2000 to 2020, we extract time-series data of NDVI, EVI and LSWI. Then, we evaluate the values of these three indices during the rice transplanting-flooding period from 2000 to 2020. If a pixel satisfies LSWI > EVI or LSWI > NDVI, it is identified as a potential rice distribution area. Second, based on the spatial distribution of potential rice areas, we perform color compositing using three consecutive months of VH-band imagery corresponding to the rice flooding, transplanting and tillering stages. Through visual interpretation, we obtain sample datasets of paddy and non-paddy fields (including forest, water bodies and urban areas) for each sub-region. Finally, using a Random Forest classifier (number of trees = 300, number of leaves = 5) with monthly VH features from Sentinel-1 and percentile features from Sentinel-2 as input variables, we conduct supervised classification for each of the 37 sub-regions sequentially. Based on the spatial distribution of potential rice areas, we obtain the 10-meter resolution spatial distribution of rice. The F1-score of the aforementioned paddy field identification ranges from 0.9 to 0.98.
提供机构:
Aerospace Information Research Institute, Chinese Academy of Sciences
搜集汇总
数据集介绍
背景与挑战
背景概述
该数据集提供了2020年东南亚和南亚地区10米分辨率的水田分布图,通过结合MODIS和Sentinel-1/2数据,采用渐进式映射算法生成,具有高精度和详细的空间分布信息,适用于粮食安全评估和农业生产研究。
以上内容由遇见数据集搜集并总结生成


