quincy918/electricity-reliability-outages-africa
收藏资源简介:
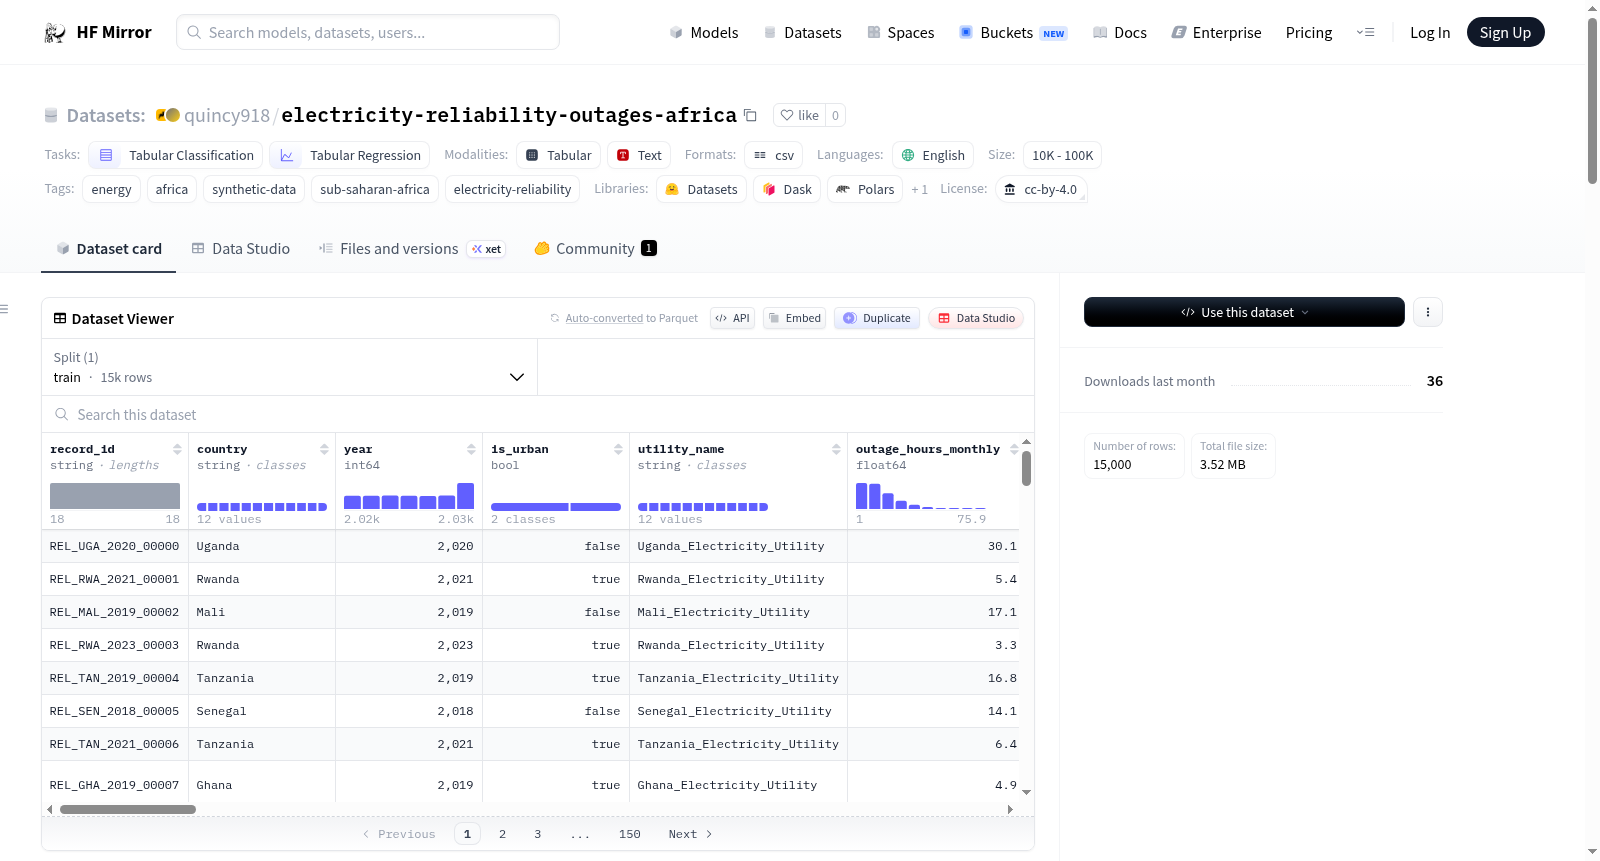
--- license: cc-by-4.0 task_categories: - tabular-classification - tabular-regression language: - en tags: - energy - africa - synthetic-data - sub-saharan-africa - electricity-reliability size_categories: - 10K<n<100K --- # Electricity Reliability and Outages - Sub-Saharan Africa Synthetic dataset capturing electricity reliability metrics, outage patterns, system losses, and service quality across Sub-Saharan African utilities, including SAIDI/SAIFI indicators and economic impacts. ## Key Statistics - **Total records**: 15,000 reliability records across 3 scenarios - **Countries covered**: Kenya, Uganda, Nigeria, Ghana, Tanzania, Ethiopia, Malawi, Zambia, Senegal, Rwanda, Niger, Mali - **Years**: 2018-2025 - **Scenarios**: low_burden (4,000), moderate_burden (5,000), high_burden (6,000) - **Average outage hours monthly**: 5-32 hours (varies by country) - **Average system losses**: 15-30% (varies by country) ## Column Descriptions | Column | Description | |--------|-------------| | `record_id` | Unique record identifier | | `country` | Country name | | `year` | Survey year (2018-2025) | | `is_urban` | Urban/rural classification | | `utility_name` | Name of electricity utility | | `outage_hours_monthly` | Monthly outage hours | | `outage_frequency_monthly` | Number of outages per month | | `avg_outage_duration_hours` | Average outage duration | | `planned_outages_monthly` | Planned outages per month | | `unplanned_outages_monthly` | Unplanned outages per month | | `saidi_annual_hours` | SAIDI - System Average Interruption Duration Index | | `saifi_annual_events` | SAIFI - System Average Interruption Frequency Index | | `avg_restoration_time_hours` | Average restoration time | | `supply_hours_daily` | Daily hours of supply | | `system_losses_pct` | Total system losses percentage | | `technical_losses_pct` | Technical losses percentage | | `commercial_losses_pct` | Commercial losses percentage | | `voltage_quality` | Voltage quality rating | | `frequency_stability` | Frequency stability rating | | `has_backup_power` | Has backup power source | | `backup_type` | Type of backup power | | `backup_hours_available` | Backup hours available | | `economic_loss_monthly_usd` | Monthly economic loss in USD | | `services_affected` | Services affected by outages | | `primary_outage_causes` | Primary causes of outages | | `reliability_rating` | Reliability rating (1-10) | | `transformer_failures_monthly` | Monthly transformer failures | | `line_faults_monthly` | Monthly line faults | | `maintenance_events_monthly` | Monthly maintenance events | | `customer_complaints_monthly` | Monthly customer complaints | | `utility_response_time_hours` | Utility response time | | `notification_before_outage` | Notification provided before outage | | `compensation_available` | Compensation available | | `smart_meter_installed` | Smart meter installed | | `scenario` | Dataset scenario | ## Usage ```python import pandas as pd # Load dataset df = pd.read_csv("electricity_reliability_outages_moderate_burden.csv") # Analyze reliability by country reliability = df.groupby('country').agg({ 'outage_hours_monthly': 'mean', 'system_losses_pct': 'mean', 'reliability_rating': 'mean' }) print(reliability) # Filter high-outage locations high_outage = df[df['outage_hours_monthly'] > 20] ``` ## Research Sources | Parameter | Value | Source | Year | |-----------|-------|--------|------| | Average outages per month | 5-12 hours | World Bank Enterprise Survey | 2023 | | Nigeria outage hours | 32 hours/month | World Bank | 2023 | | Kenya outage hours | 6 hours/month | KPLC | 2023 | | Ghana outage hours | 8 hours/month | ECG | 2023 | | System losses average | 17-25% | World Bank | 2023 | | Technical losses | 10-15% | Various utilities | 2023 | | Commercial losses | 8-15% | Various utilities | 2023 | | SAIDI average SSA | 50-100 hrs/yr | IEEE | 2023 | | SAIFI average SSA | 50-100 events | IEEE | 2023 | | Average restoration time | 2-8 hours | Utility reports | 2023 | **Author**: Electric Sheep Africa
--- 许可证:CC BY 4.0(知识共享署名4.0协议) 任务类别: - 表格分类 - 表格回归 语言: - 英语 标签: - 能源 - 非洲 - 合成数据集 - 撒哈拉以南非洲 - 电力可靠性 数据规模:10000条 < 样本量 < 100000条 --- # 电力可靠性与停电数据集——撒哈拉以南非洲 本合成数据集涵盖撒哈拉以南非洲各国电力公司的电力可靠性指标、停电模式、系统损耗与服务质量相关数据,包含系统平均停电持续时间指数(SAIDI, System Average Interruption Duration Index)、系统平均停电频率指数(SAIFI, System Average Interruption Frequency Index)以及经济影响类指标。 ## 关键统计数据 - **总记录数**:3种场景下共计15000条可靠性记录 - **覆盖国家**:肯尼亚、乌干达、尼日利亚、加纳、坦桑尼亚、埃塞俄比亚、马拉维、赞比亚、塞内加尔、卢旺达、尼日尔、马里 - **时间跨度**:2018年至2025年 - **场景分类**:低负担场景(4000条)、中等负担场景(5000条)、高负担场景(6000条) - **月均停电时长**:5至32小时(因国家不同存在差异) - **系统平均损耗率**:15%至30%(因国家不同存在差异) ## 字段说明 | 字段名 | 字段说明 | |--------|----------| | `record_id` | 唯一记录标识符 | | `country` | 国家名称 | | `year` | 调研年份(2018-2025) | | `is_urban` | 城乡分类标识 | | `utility_name` | 电力公司名称 | | `outage_hours_monthly` | 月均停电时长 | | `outage_frequency_monthly` | 月均停电次数 | | `avg_outage_duration_hours` | 单次停电平均时长 | | `planned_outages_monthly` | 月均计划停电次数 | | `unplanned_outages_monthly` | 月均非计划停电次数 | | `saidi_annual_hours` | 年度系统平均停电持续时间指数(SAIDI, System Average Interruption Duration Index) | | `saifi_annual_events` | 年度系统平均停电频率指数(SAIFI, System Average Interruption Frequency Index) | | `avg_restoration_time_hours` | 平均故障恢复时长 | | `supply_hours_daily` | 每日供电时长 | | `system_losses_pct` | 总系统损耗率 | | `technical_losses_pct` | 技术损耗率 | | `commercial_losses_pct` | 商业损耗率 | | `voltage_quality` | 电压质量评级 | | `frequency_stability` | 频率稳定性评级 | | `has_backup_power` | 是否配备备用电源 | | `backup_type` | 备用电源类型 | | `backup_hours_available` | 备用电源可续航时长 | | `economic_loss_monthly_usd` | 月度经济损失(单位:美元) | | `services_affected` | 受停电影响的服务类型 | | `primary_outage_causes` | 停电主要诱因 | | `reliability_rating` | 可靠性评级(1-10分) | | `transformer_failures_monthly` | 月度变压器故障次数 | | `line_faults_monthly` | 月度线路故障次数 | | `maintenance_events_monthly` | 月度维护事件次数 | | `customer_complaints_monthly` | 月度客户投诉量 | | `utility_response_time_hours` | 电力公司响应时长 | | `notification_before_outage` | 停电前是否提前通知 | | `compensation_available` | 是否提供停电补偿 | | `smart_meter_installed` | 是否安装智能电表 | | `scenario` | 数据集场景标签 | ## 使用方法 python import pandas as pd # Load dataset df = pd.read_csv("electricity_reliability_outages_moderate_burden.csv") # Analyze reliability by country reliability = df.groupby('country').agg({ 'outage_hours_monthly': 'mean', 'system_losses_pct': 'mean', 'reliability_rating': 'mean' }) print(reliability) # Filter high-outage locations high_outage = df[df['outage_hours_monthly'] > 20] ## 研究数据来源 | 参数 | 数值范围 | 来源 | 年份 | |-----------|-------|--------|------| | 月均停电次数 | 5-12次 | 世界银行企业调查 | 2023 | | 尼日利亚月均停电时长 | 32小时/月 | 世界银行 | 2023 | | 肯尼亚月均停电时长 | 6小时/月 | 肯尼亚电力与照明公司(KPLC) | 2023 | | 加纳月均停电时长 | 8小时/月 | 加纳电力公司(ECG) | 2023 | | 系统平均损耗率 | 17%-25% | 世界银行 | 2023 | | 技术损耗率 | 10%-15% | 多家电力企业 | 2023 | | 商业损耗率 | 8%-15% | 多家电力企业 | 2023 | | 撒哈拉以南非洲地区SAIDI年均值 | 50-100小时 | 电气和电子工程师协会(IEEE) | 2023 | | 撒哈拉以南非洲地区SAIFI年均值 | 50-100次 | 电气和电子工程师协会(IEEE) | 2023 | | 平均故障恢复时长 | 2-8小时 | 电力公司报告 | 2023 | **数据集作者**:Electric Sheep Africa