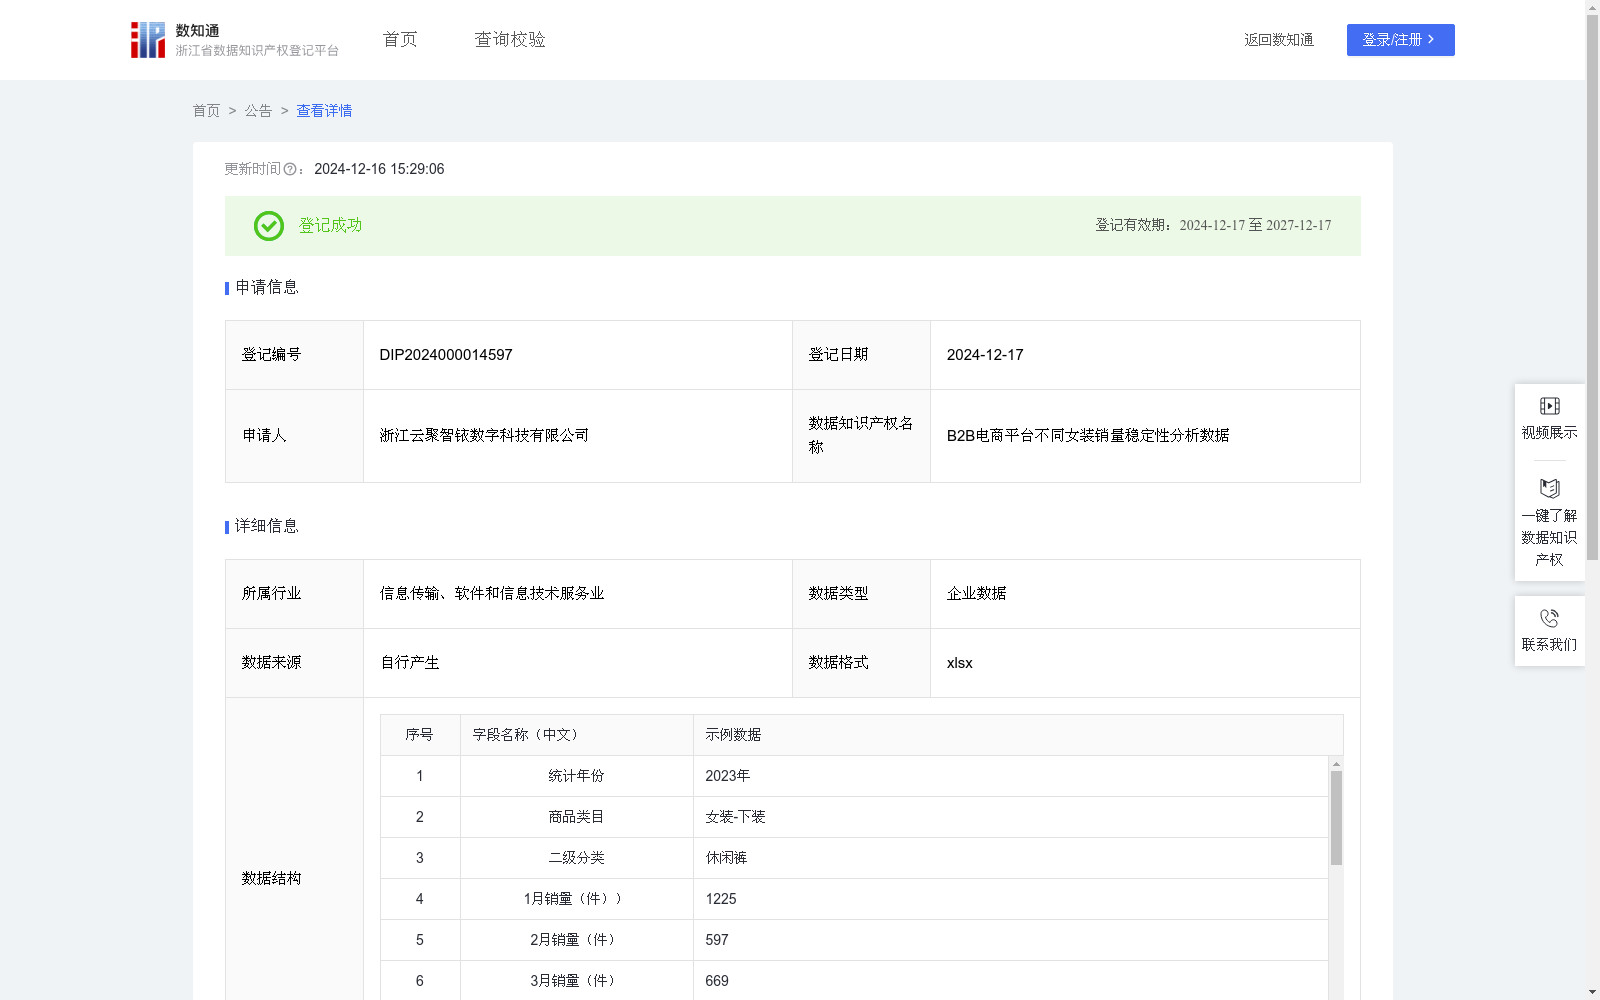
B2B电商平台不同女装销量稳定性分析数据
收藏浙江省数据知识产权登记平台2024-12-16 更新2024-12-17 收录
下载链接:
https://www.zjip.org.cn/home/announce/trends/104845
下载链接
链接失效反馈官方服务:
资源简介:
本数据对女装生产商的女装产品的选择开发、生产计划调整和库存管理及女装销售商的市场策略制定等方面具有重要的应用价值,具体包括:1.利用销量稳定性分析数据,女装生产商能够识别出在B2B电商平台销售表现稳定的女装类别,为新产品的选择开发提供数据支持,同时,通过销量稳定性分析有助于了解不同类别的女装产品在B2B电商平台的销售需求波动风险,从而有针对性地调整生产和供货计划,并进行库存管理优化。2.对于女装销售商而言,本数据可为其了解不同类别女装的市场趋势、明确自身产品定位和市场策略等提供参考。1.数据收集和预处理:(1)数据收集:收集公司在自建的纺织服装数据流通平台上不同类别女装的销售统计信息,具体包括统计年份、商品类目、二级分类、1月销量、2月销量、3月销量、4月销量、5月销量、6月销量、7月销量、8月销量、9月销量、10月销量、11月销量、12月销量。(2)数据预处理:对采集到的原始数据进行处理,去除缺失和异常数据。 2.数据汇总:将1至12月的销量汇总,计算得到年度总销量。 3.建立销量稳定性分析模型:(1)计算月平均销售量:计算月平均销售量=年度总销量/12;(2)计算月销售量方差:月销售量方差=[(1月销量-月平均销售量)^2+(2月销量-月平均销售量)^2+(3月销量-月平均销售量)^2+…+(12月销量-月平均销售量)^2]/12;(3)销量稳定性分析:基于内部专家研讨,确定当方差小于50000,则分析结论为“销量很平稳”;当方差大于等于50000且小于等于100000,则分析结论为“销量一般平稳”;当方差大于100000,则分析结论为“销量波动大”。
This dataset holds significant application value for women's clothing manufacturers in terms of women's apparel product selection and development, production plan adjustment, inventory management, as well as for women's clothing retailers in formulating marketing strategies. The specific application scenarios are as follows:
1. For women's clothing manufacturers: By utilizing sales stability analysis data, they can identify women's apparel categories with stable sales performance on B2B e-commerce platforms, providing data support for the selection and development of new products. Additionally, sales stability analysis helps understand the sales demand fluctuation risks of different women's apparel categories on B2B e-commerce platforms, enabling targeted adjustments to production and supply plans as well as optimization of inventory management.
2. For women's clothing retailers: This dataset can serve as a reference for them to understand market trends of different women's apparel categories, clarify their own product positioning and marketing strategies.
The dataset construction process includes:
1. Data Collection and Preprocessing:
(1) Data Collection: Collect sales statistics of different women's apparel categories on the company's self-built textile and apparel data circulation platform, specifically including statistical year, product category, secondary category, sales volume in January, February, March, April, May, June, July, August, September, October, November, December.
(2) Data Preprocessing: Process the collected raw data by removing missing and abnormal data.
2. Data Aggregation: Sum the sales volumes from January to December to calculate the annual total sales volume.
3. Establishment of Sales Stability Analysis Model:
(1) Calculate monthly average sales volume: Monthly average sales volume = Annual total sales volume / 12;
(2) Calculate monthly sales variance: Monthly sales variance = [(January sales - Monthly average sales volume)² + (February sales - Monthly average sales volume)² + (March sales - Monthly average sales volume)² + … + (December sales - Monthly average sales volume)²] / 12;
(3) Sales stability analysis: Based on internal expert discussions, the analysis conclusions are determined as follows: if the variance is less than 50,000, the conclusion is "Very stable sales"; if the variance is greater than or equal to 50,000 and less than or equal to 100,000, the conclusion is "Generally stable sales"; if the variance is greater than 100,000, the conclusion is "Large sales fluctuations".
提供机构:
浙江云聚智铱数字科技有限公司
创建时间:
2024-11-03
搜集汇总
数据集介绍
特点
该数据集包含B2B电商平台不同女装的月度销量数据,通过计算月平均销售量和方差来分析销量稳定性,适用于女装生产和销售企业的决策支持。数据规模为535条,每年更新一次。
以上内容由遇见数据集搜集并总结生成


