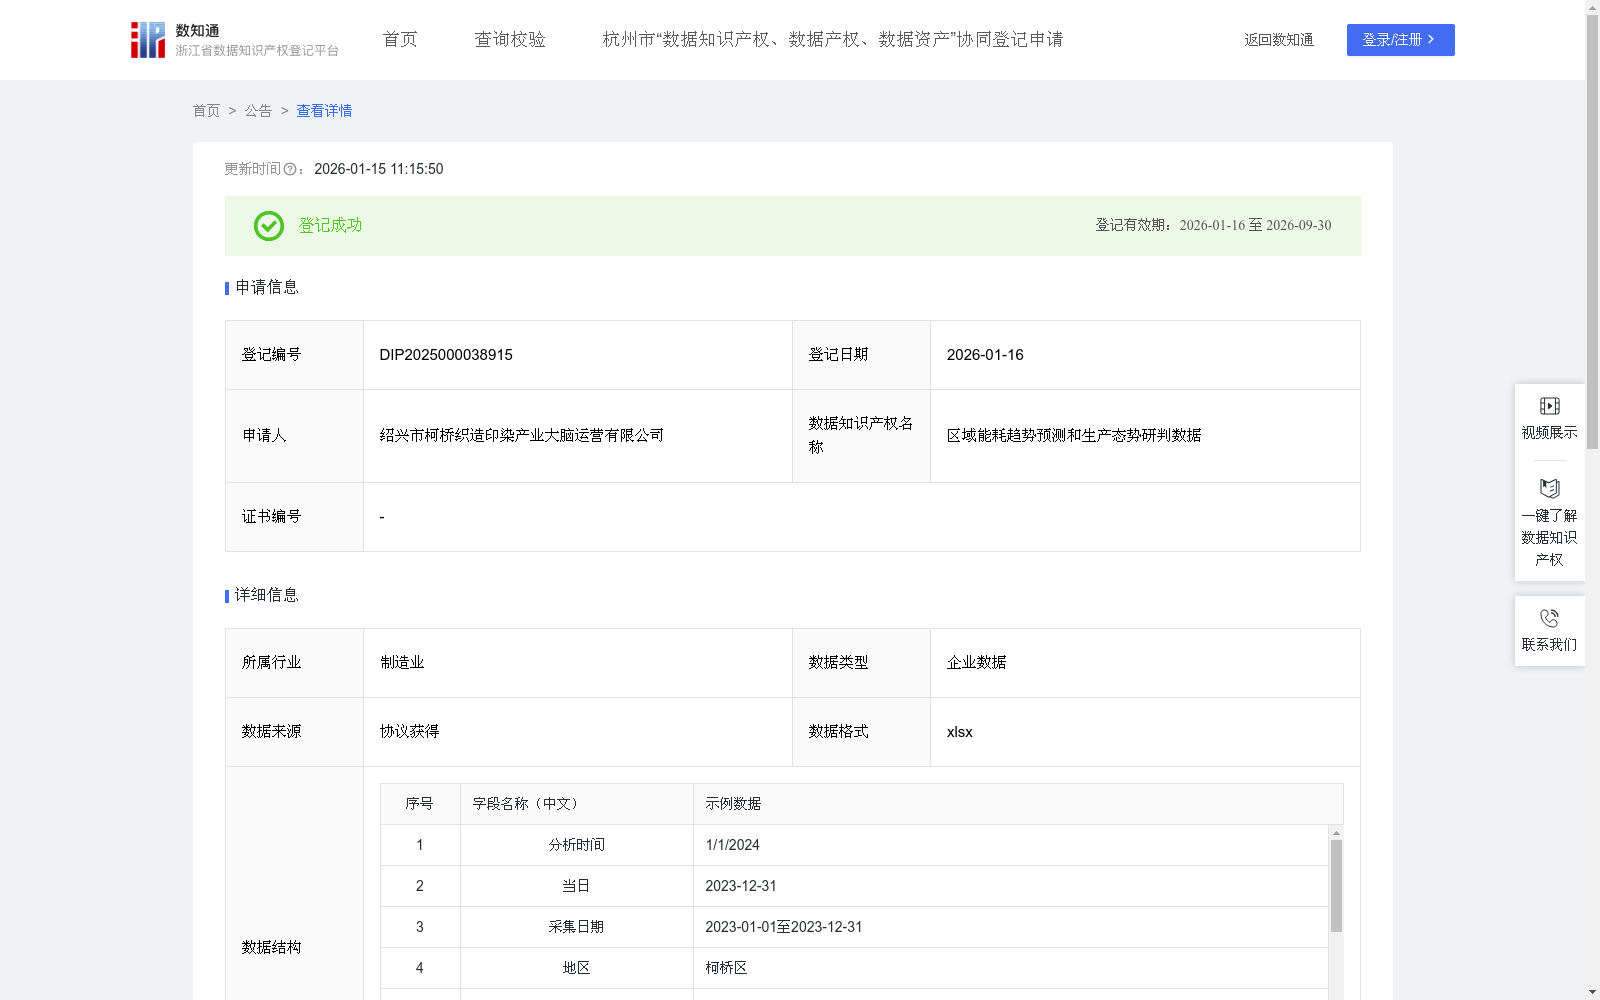
区域能耗趋势预测和生产态势研判数据
收藏浙江省数据知识产权登记平台2026-01-15 更新2026-01-16 收录
下载链接:
https://www.zjip.org.cn/home/announce/trends/8423672
下载链接
链接失效反馈官方服务:
资源简介:
本数据集及算法模型基于绍兴柯桥地区印染企业的多能源消耗数据构建,主要用于区域能耗预测与生产态势研判,为政府管理部门、园区运营方、企业管理层及能源供应相关方提供决策支持。
1.区域生产态势监测与研判:
通过对电力、蒸汽、燃气、水等多类型能源消耗指数的综合分析,可实时反映区域工业生产活跃程度,为判断区域经济运行状态提供高频、客观的数据支撑。其核心假设为:在产业结构相对稳定的区域内,能源消耗强度与生产活跃度具有高度相关性。当综合能耗指数持续高于历史基准水平时,判定区域生产态势处于“活跃”或“扩张”状态;当综合能耗指数持续低于历史基准水平时,判定区域生产态势处于“放缓”或“收缩”状态。
2.能耗趋势预测与调度优化:
基于区域历史能耗数据构建的预测模型,可提前预判未来周期内能源需求变化,辅助能源供应单位进行发电、供气、供热及供水调度安排,降低供需失衡风险。1.数据采集:采集绍兴柯桥地区内印染企业能源消耗相关数据,数据来源包括企业能源计量系统、能源管理系统、工业互联网平台及公共能源统计接口。采集的基础数据以“日”为最小时间粒度,记录内容包括日期、能耗数值及能耗类型标识。采集字段包括电力消耗(度)、蒸汽消耗(吨)、天然气消耗(立方)及用水量(吨),数值字段为对应能耗类型在当日的实际消耗量。采集期间为分析时间所处月份的前12个月,例如,若分析时间为2024年10月1日,则采集期间为2023年10月1日至2024年9月30日。
2.数据处理:对采集到的区域能耗原始数据进行统一处理,确保不同能源类型之间具备可比性和可计算性:
(1)数据清洗:剔除缺失日期、异常突增或明显偏离物理规律的记录,并对短期缺失数据采用临近时间插值或历史均值补齐;
(2)单位统一与标准化:针对电、蒸汽、燃气、水等不同计量单位的数据,通过能耗折标或指数化处理,将其统一转换为标准化能耗指数;
(3)数据归集:按照“日期—能耗类型”维度对数据进行汇总,形成区域多能源结构的时间序列数据,为后续综合分析提供基础。
3.数据加工与分析:
(1)用水/电力/蒸汽/燃气指数计算规则:
用水/电力/蒸汽/燃气指数用于描述某一能源类型(用水/电力/蒸汽/燃气)在特定日期下的相对消耗水平。
其计算方式为:用水/电力/蒸汽/燃气指数 = 当日用水/电力/蒸汽/燃气消耗量 ÷ 用水/电力/蒸汽/燃气历史基准期(日均消耗量) × 100。
其中,历史基准期通常选取过去12个月数据计算得出,用于反映该能源在区域内的长期正常消耗水平。
(2)综合能耗指数计算规则:
综合能耗指数,区域综合能耗指数在单能源能耗指数基础上,通过加权方式,用于反映整体能源使用强度与生产活跃程度。
其计算方式为:
区域综合能耗指数 = 电力指数 × w₁ + 蒸汽指数 × w₂ + 燃气指数 × w₃ + 用水指数 × w₄。
其中,权重 w₁、w₂、w₃、w₄ 依据该地区能源结构占比或产业特征确定,例如柯桥印染企业制造业占比较高,取权重系数分别为0.3,0.2,0.2,0.3。
This dataset and algorithm model are constructed based on multi-energy consumption data of printing and dyeing enterprises in Keqiao District, Shaoxing. It is mainly used for regional energy consumption forecasting and production situation assessment, providing decision support for government regulatory departments, park operators, enterprise management teams and relevant energy supply stakeholders.
1. Regional Production Situation Monitoring and Assessment:
Through comprehensive analysis of multi-type energy consumption indicators such as electricity, steam, natural gas and water, the active level of regional industrial production can be reflected in real time, providing high-frequency and objective data support for judging the regional economic operation status. Its core hypothesis is that in regions with relatively stable industrial structures, energy consumption intensity is highly correlated with production activity. When the comprehensive energy consumption index continues to be higher than the historical baseline level, the regional production situation is judged to be "active" or "expanding"; when the comprehensive energy consumption index continues to be lower than the historical baseline level, the regional production situation is judged to be "slowing down" or "contracting".
2. Energy Consumption Trend Forecasting and Scheduling Optimization:
The forecasting model built based on regional historical energy consumption data can predict changes in energy demand in future cycles in advance, assisting energy supply units in arranging power generation, gas supply, heating and water supply scheduling, and reducing the risk of supply-demand imbalance.
1. Data Collection:
Relevant energy consumption data of printing and dyeing enterprises in Keqiao District, Shaoxing are collected. The data sources include enterprise energy metering systems, energy management systems, industrial internet platforms and public energy statistics interfaces. The minimum time granularity of the collected basic data is "day", and the recorded contents include date, energy consumption value and energy consumption type identifier. The collected fields include electricity consumption (kWh), steam consumption (tons), natural gas consumption (cubic meters) and water consumption (tons), where the numerical fields represent the actual consumption of the corresponding energy type on that day. The data collection period is the 12 months prior to the month of the analysis date. For example, if the analysis date is October 1, 2024, the collection period is from October 1, 2023 to September 30, 2024.
2. Data Processing:
Unified processing is performed on the collected regional raw energy consumption data to ensure comparability and computability between different energy types:
(1) Data Cleaning: Records with missing dates, abnormal sudden spikes or obvious deviations from physical laws are removed, and short-term missing data are supplemented by adjacent time interpolation or historical mean imputation;
(2) Unit Unification and Standardization: For data with different measurement units such as electricity, steam, natural gas and water, they are uniformly converted into standardized energy consumption indexes through energy equivalent conversion or indexation processing;
(3) Data Aggregation: Data are summarized according to the "date - energy consumption type" dimension to form time-series data of regional multi-energy structure, providing a basis for subsequent comprehensive analysis.
3. Data Processing and Analysis:
(1) Calculation Rules for Water/Electricity/Steam/Natural Gas Index:
The water/electricity/steam/natural gas index is used to describe the relative consumption level of a certain energy type (water/electricity/steam/natural gas) on a specific date.
Its calculation formula is: Water/Electricity/Steam/Natural Gas Index = Daily water/electricity/steam/natural gas consumption ÷ Average daily water/electricity/steam/natural gas consumption of the historical baseline period × 100.
Among them, the historical baseline period is usually selected from the data of the past 12 months to reflect the long-term normal consumption level of this energy in the region.
(2) Calculation Rules for Comprehensive Energy Consumption Index:
The regional comprehensive energy consumption index is based on the single-energy consumption index, and uses a weighted averaging method to reflect the overall energy use intensity and production activity level.
Its calculation formula is:
Regional Comprehensive Energy Consumption Index = Electricity Index × w₁ + Steam Index × w₂ + Natural Gas Index × w₃ + Water Index × w₄.
Among them, the weights w₁, w₂, w₃, w₄ are determined based on the local energy structure proportion or industrial characteristics. For example, printing and dyeing enterprises in Keqiao District have a relatively high proportion of manufacturing, so the weight coefficients are set to 0.3, 0.2, 0.2 and 0.3 respectively.
提供机构:
绍兴市柯桥织造印染产业大脑运营有限公司
创建时间:
2025-12-19
搜集汇总
数据集介绍
背景与挑战
背景概述
该数据集聚焦于绍兴柯桥地区印染企业的多能源消耗数据,包含电力、蒸汽、燃气和水的日度消耗量及相关指数,旨在通过综合能耗指数实时研判区域生产态势,并基于历史数据预测能耗趋势,为政府、园区和企业提供决策支持。数据集每日更新,涵盖518条记录,采用加权方法计算综合能耗指数,以反映能源使用强度与生产活跃度的相关性,适用于制造业能耗监控与调度优化场景。
以上内容由遇见数据集搜集并总结生成


