北半球年平均气温空间分布和时间变化趋势特征数据(1971-2000)
收藏国家青藏高原科学数据中心2021-04-19 更新2024-03-01 收录
下载链接:
https://data.tpdc.ac.cn/zh-hans/data/0a88eeba-39d0-4341-9547-df715412f7de
下载链接
链接失效反馈官方服务:
资源简介:
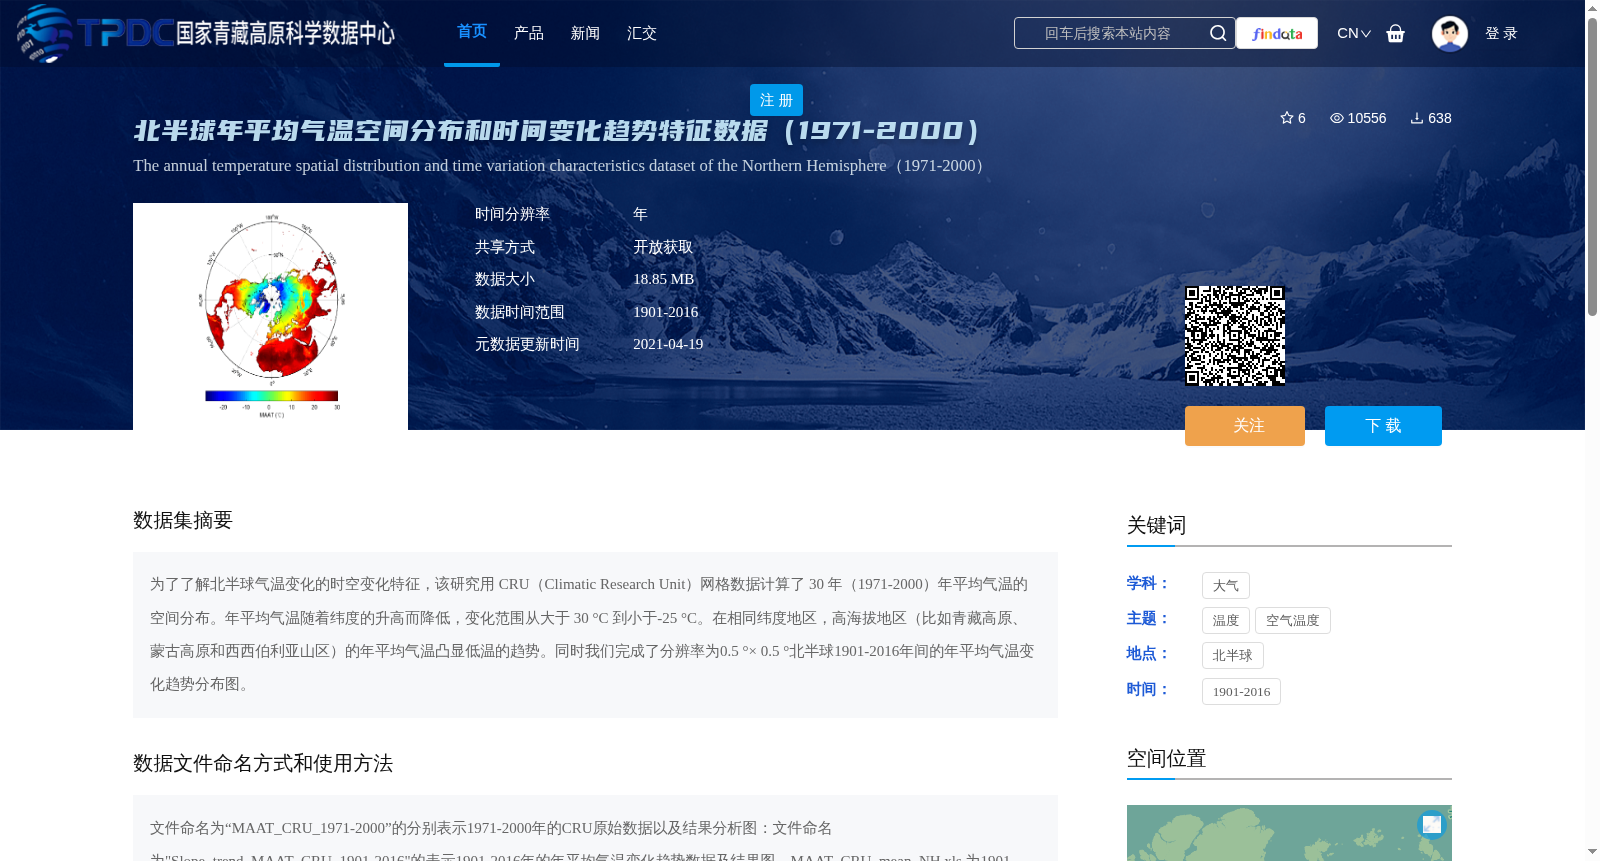
为了了解北半球气温变化的时空变化特征,该研究用 CRU(Climatic Research Unit)网格数据计算了 30 年(1971-2000)年平均气温的空间分布。年平均气温随着纬度的升高而降低,变化范围从大于 30 °C 到小于-25 °C。在相同纬度地区,高海拔地区(比如青藏高原、蒙古高原和西西伯利亚山区)的年平均气温凸显低温的趋势。同时我们完成了分辨率为0.5 °× 0.5 °北半球1901-2016年间的年平均气温变化趋势分布图。
To investigate the spatiotemporal variation characteristics of temperature changes over the Northern Hemisphere, this study calculated the spatial distribution of 30-year (1971–2000) average air temperature using CRU (Climatic Research Unit) gridded datasets. The annual average air temperature decreases with increasing latitude, ranging from above 30 °C to below -25 °C. At the same latitude, high-altitude regions such as the Tibetan Plateau, Mongolian Plateau and Western Siberian mountains show significantly lower annual average air temperatures. Meanwhile, we generated the distribution map of annual average air temperature change trends over the Northern Hemisphere during 1901–2016 with a spatial resolution of 0.5° × 0.5°.
提供机构:
尹国安,石亚亚
创建时间:
2019-12-20
搜集汇总
数据集介绍
背景与挑战
背景概述
该数据集提供了北半球1971-2000年的年平均气温空间分布和1901-2016年的气温变化趋势数据,空间分辨率为0.5°×0.5°,数据格式为.nc和.tif,适用于气候研究。
以上内容由遇见数据集搜集并总结生成


