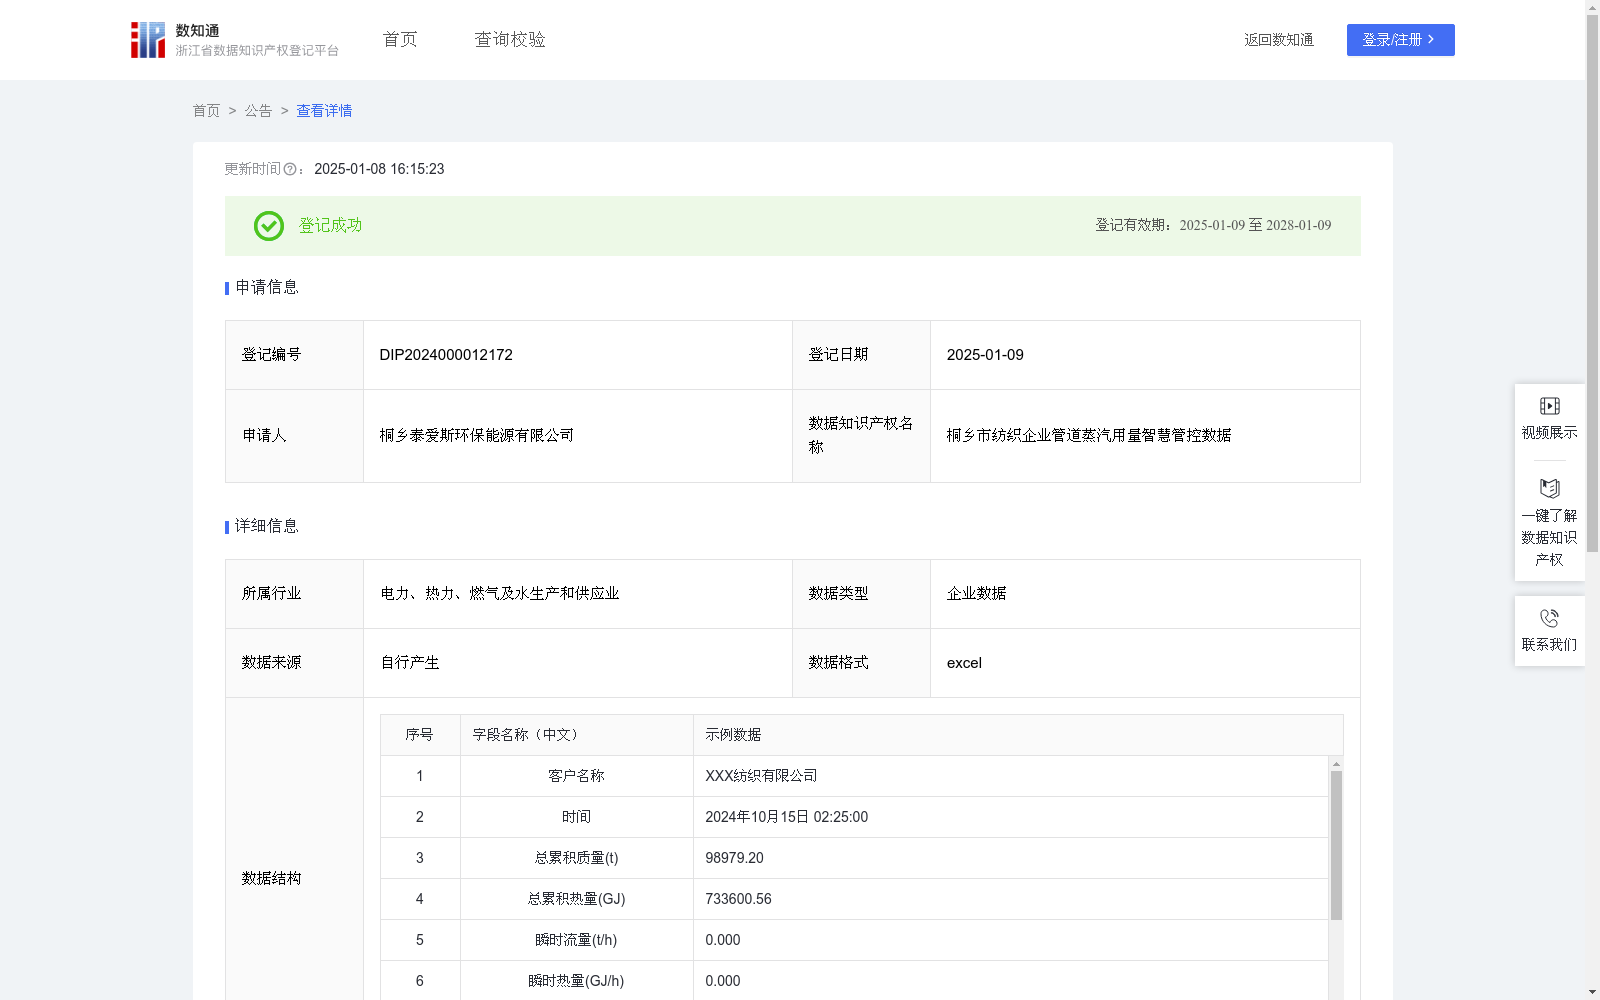
桐乡市纺织企业管道蒸汽用量智慧管控数据
收藏浙江省数据知识产权登记平台2025-01-08 更新2025-01-09 收录
下载链接:
https://www.zjip.org.cn/home/announce/trends/110637
下载链接
链接失效反馈官方服务:
资源简介:
通过收集和分析纺织企业管道蒸汽用量的时间、总累积质量、总累积热量、瞬时流量、瞬时热量、瞬时温度、瞬时压力、密度、输入电流等相关数据,了解纺织行业对用热量的需求,以及对客户的用热量影响分析,能够更准确地预测其生产过程中的用热量,以便更好地进行能源管理和成本控制,利于纺织类企业自我管控。将该模型应用于纺织企业实际生产中,每天根据当天的生产计划和设备运行参数,预测当天的蒸汽用量。企业可以根据预测结果合理安排能源供应,优化生产调度,降低能源成本。同时,通过对蒸汽用量的实时监测和分析,及时发现能源浪费和管道故障等问题,提高能源利用效率和生产效益,实现绿色生产,对纺织业类的企业生产过程有指导作用。科研机构可以利用纺织企业的管道蒸汽用量智慧管控数据,开展能源管理技术的研究和创新。通过对大量数据的分析和挖掘,科研机构可以深入了解纺织企业的蒸汽用量规律和节能潜力,研发出更适合纺织行业的能源管理技术和设备。构建神经网络模型,步骤1:采用多层感知机(MLP)结构,包括一个输入层、两个隐藏层和一个输出层。输入层节点数为9,分别对应时间、总累积质量、总累积热量、瞬时流量、瞬时热量、瞬时温度、瞬时压力、密度、输入电流。两个隐藏层分别有64个和32个节点,激活函数采用ReLU。输出层节点数为1,对应预测的蒸汽用量。步骤2:选择损失函数和优化算法。使用均方误差(MSE)作为损失函数,优化算法选择Adam,学习率设置为0.001。步骤3:将数据集划分为训练集、验证集和测试集,比例为7:2:1。使用训练集对神经网络进行训练,设置训练轮数为100轮,批次大小为32。在训练过程中,实时监控验证集的损失,当验证集损失连续 10 轮没有下降时,提前停止训练,防止过拟合。步骤4:对模型进行超参数调整,尝试不同的隐藏层节点数、学习率和批次大小等参数,找到最佳的模型性能。步骤5:神经网络模型输出预测蒸汽流量值和最高临界值为22.01t/h,当预测蒸汽流量值>22.01t/h,管道状态显示“管道异常”,当0≤预测蒸汽流量值≤22.01t/h,显示“管道正常”。
By collecting and analyzing relevant data including time, total cumulative mass, total cumulative heat, instantaneous flow rate, instantaneous heat, instantaneous temperature, instantaneous pressure, density, and input current related to pipeline steam consumption in textile enterprises, this study aims to understand the heat demand of the textile industry and analyze the impact of heat consumption on customers, thereby enabling more accurate prediction of heat consumption during production, facilitating better energy management and cost control, and supporting self-management of textile enterprises. When applied to actual production of textile enterprises, the model can predict daily steam consumption based on that day’s production plan and equipment operating parameters. Enterprises can then rationally arrange energy supply, optimize production scheduling, and reduce energy costs according to the prediction results. Meanwhile, real-time monitoring and analysis of steam consumption can help detect issues such as energy waste and pipeline faults in a timely manner, improve energy utilization efficiency and production benefits, achieve green production, and provide guidance for the production processes of textile enterprises. Research institutions can use the smart management data of pipeline steam consumption from textile enterprises to carry out research and innovation of energy management technologies. Through analysis and mining of large-scale data, research institutions can gain in-depth insights into the steam consumption patterns and energy-saving potential of textile enterprises, and develop energy management technologies and equipment more suitable for the textile industry. To construct the neural network model: Step 1: Adopt a Multi-Layer Perceptron (MLP) structure, which includes one input layer, two hidden layers, and one output layer. The input layer has 9 nodes, corresponding to time, total cumulative mass, total cumulative heat, instantaneous flow rate, instantaneous heat, instantaneous temperature, instantaneous pressure, density, and input current, respectively. The two hidden layers have 64 and 32 nodes respectively, with ReLU as the activation function. The output layer has 1 node, corresponding to the predicted steam consumption. Step 2: Select the loss function and optimization algorithm. Use Mean Squared Error (MSE) as the loss function, select Adam as the optimization algorithm, and set the learning rate to 0.001. Step 3: Split the dataset into training, validation, and test sets at a ratio of 7:2:1. Train the neural network using the training set, with the number of training epochs set to 100 and batch size set to 32. During training, monitor the validation loss in real time, and stop training early if the validation loss does not decrease for 10 consecutive epochs to prevent overfitting. Step 4: Perform hyperparameter tuning on the model, try different parameters such as the number of hidden layer nodes, learning rate, and batch size, to find the optimal model performance. Step 5: The neural network model outputs the predicted steam flow value, with a maximum critical value of 22.01 t/h. If the predicted steam flow value exceeds 22.01 t/h, the pipeline status will display "Pipeline Abnormal"; if 0 ≤ predicted steam flow value ≤ 22.01 t/h, the status will display "Pipeline Normal".
提供机构:
桐乡泰爱斯环保能源有限公司
创建时间:
2024-10-21
搜集汇总
数据集介绍
以上内容由遇见数据集搜集并总结生成


