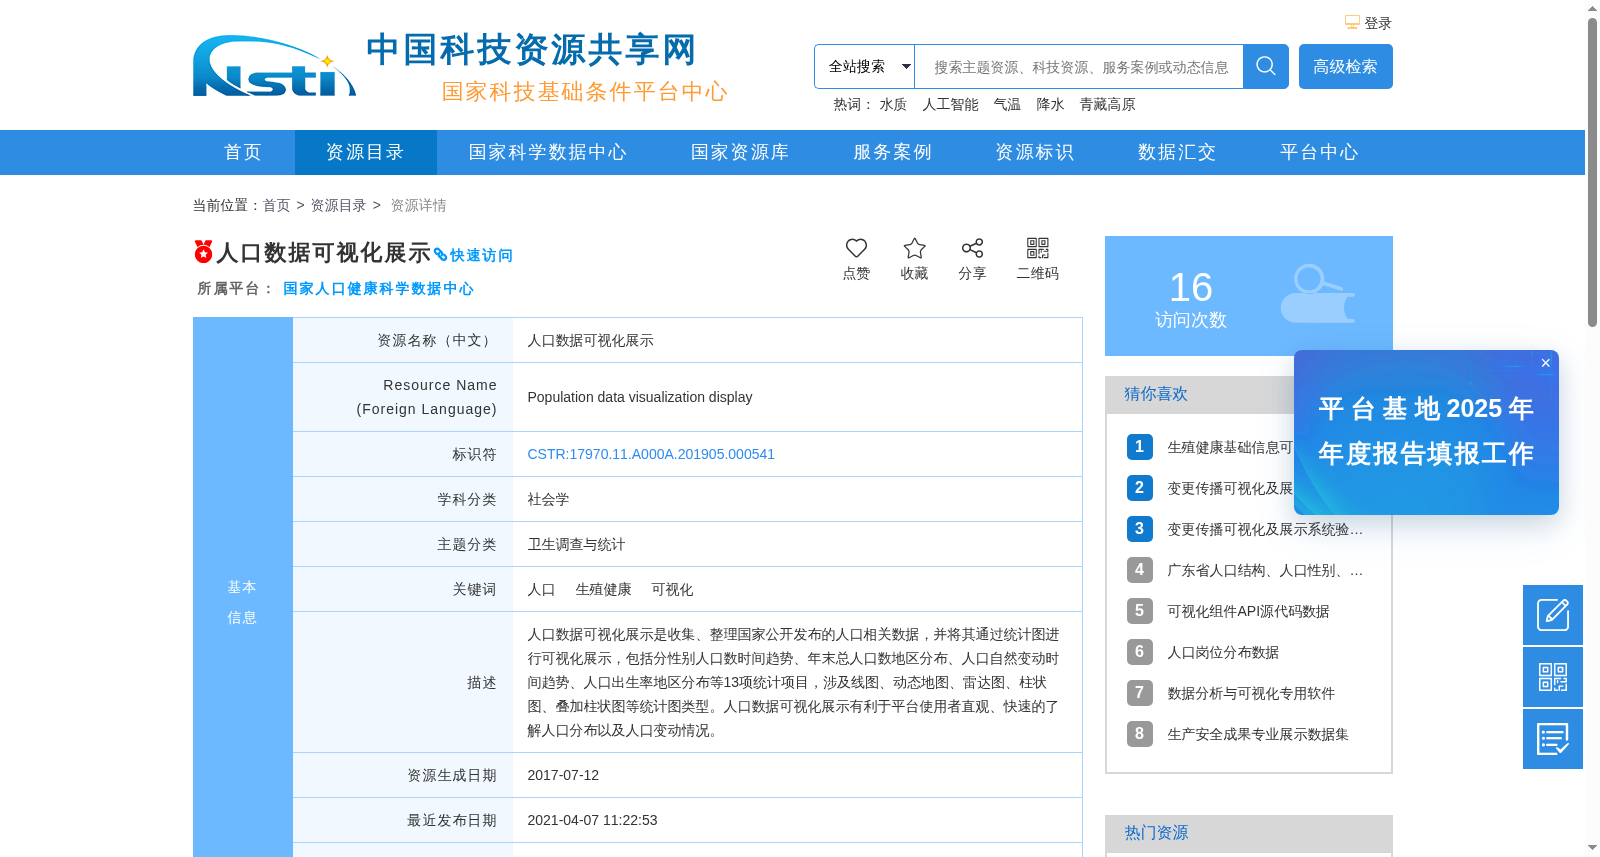
人口数据可视化展示
收藏资源简介:
人口数据可视化展示是收集、整理国家公开发布的人口相关数据,并将其通过统计图进行可视化展示,包括分性别人口数时间趋势、年末总人口数地区分布、人口自然变动时间趋势、人口出生率地区分布等13项统计项目,涉及线图、动态地图、雷达图、柱状图、叠加柱状图等统计图类型。人口数据可视化展示有利于平台使用者直观、快速的了解人口分布以及人口变动情况。
Population data visualization refers to the collection and organization of publicly released national population-related data, followed by its visualization via statistical charts. This dataset covers 13 statistical items, including time trends of gender-disaggregated population counts, regional distribution of total year-end population, time trends of natural population changes, regional distribution of crude birth rates, and others. The supported chart types include line charts, dynamic maps, radar charts, bar charts, stacked bar charts, and more. Such population data visualizations enable platform users to intuitively and rapidly grasp population distribution patterns and population change dynamics.