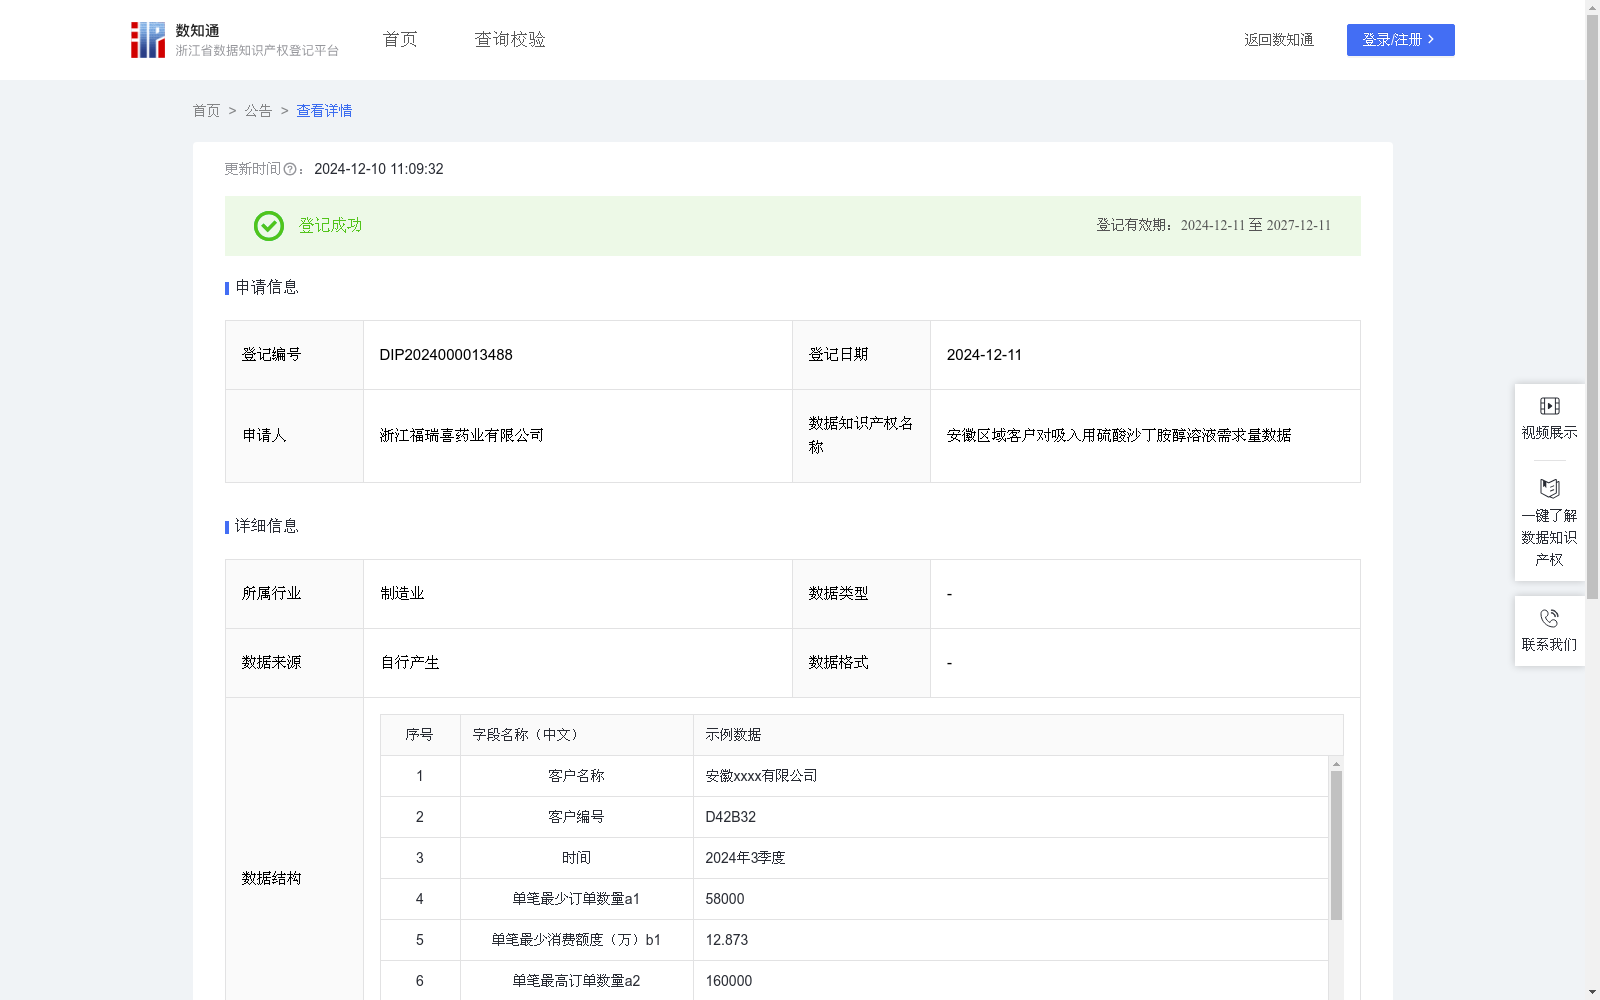
安徽区域客户对吸入用硫酸沙丁胺醇溶液需求量数据
收藏资源简介:
通过收集和分析安徽区域客户对吸入用硫酸沙丁胺醇溶液的需求量数据消费相关数据,了解客户对吸入用硫酸沙丁胺醇溶液的需求量的购买力水平和消费偏好,从而了解该产品是否畅销,从而为本行业的所有企业制定生产策略,更好地为用户提供个性化的商品和服务。1.数据采集:采集平时客户对吸入用硫酸沙丁胺醇溶液的需求量的相关交易数据。2.数据处理:对采集到数据进行分类、合并、累加,便于分析使用。3.算法加工:将处理后的数据进行需求量分析:P={a1(单笔最少订单数量)/b1(单笔最少消费额度)+a2(单笔最高订单数量)/b2(单笔最高消费额度)+a3(平均订单数量)/b3(平均消费额度)}*k,k为消费系数,不同地区系数大小值不同,按经验取值安徽k值为0.6。4、数据分类分级:根据计算出的需求量水平,将客户等级划分为“高、中、低”不同的类别和级别(10000分以上标记为“高等级”,6000-10000分区间内标记为“中等级”,6000分以下标记为“低等级”)。
This dataset is developed by collecting and analyzing demand and consumption-related data of customers in the Anhui region for Salbutamol Sulfate Solution for Inhalation, with the objectives of understanding the purchasing power level and consumption preferences of customers for this product, evaluating its market popularity, and further formulating production strategies for all enterprises in the industry to better deliver personalized products and services to users. 1. Data Collection: Collect routine transaction data related to the demand volume of Salbutamol Sulfate Solution for Inhalation from customers. 2. Data Preprocessing: Classify, merge and aggregate the collected data to facilitate subsequent analytical operations. 3. Algorithm-based Demand Analysis: Perform demand volume analysis on the preprocessed data using the following formula: $P = left( frac{a_1 ( ext{minimum single-order quantity})}{b_1 ( ext{minimum single-order consumption amount})} + frac{a_2 ( ext{maximum single-order quantity})}{b_2 ( ext{maximum single-order consumption amount})} + frac{a_3 ( ext{average order quantity})}{b_3 ( ext{average consumption amount})} ight) imes k$ Where $a_1$ represents the minimum single-order quantity, $b_1$ represents the minimum single-order consumption amount, $a_2$ represents the maximum single-order quantity, $b_2$ represents the maximum single-order consumption amount, $a_3$ represents the average order quantity, $b_3$ represents the average consumption amount, $k$ is the consumption coefficient with varying values across different regions. Based on empirical values, the $k$ value for the Anhui region is set to 0.6. 4. Data Classification and Grading: Divide customers into three tiers: "high-level", "medium-level" and "low-level" based on the calculated demand score. Specifically, customers with a score above 10000 are marked as "high-level", those with a score between 6000 and 10000 are marked as "medium-level", and those with a score below 6000 are marked as "low-level".