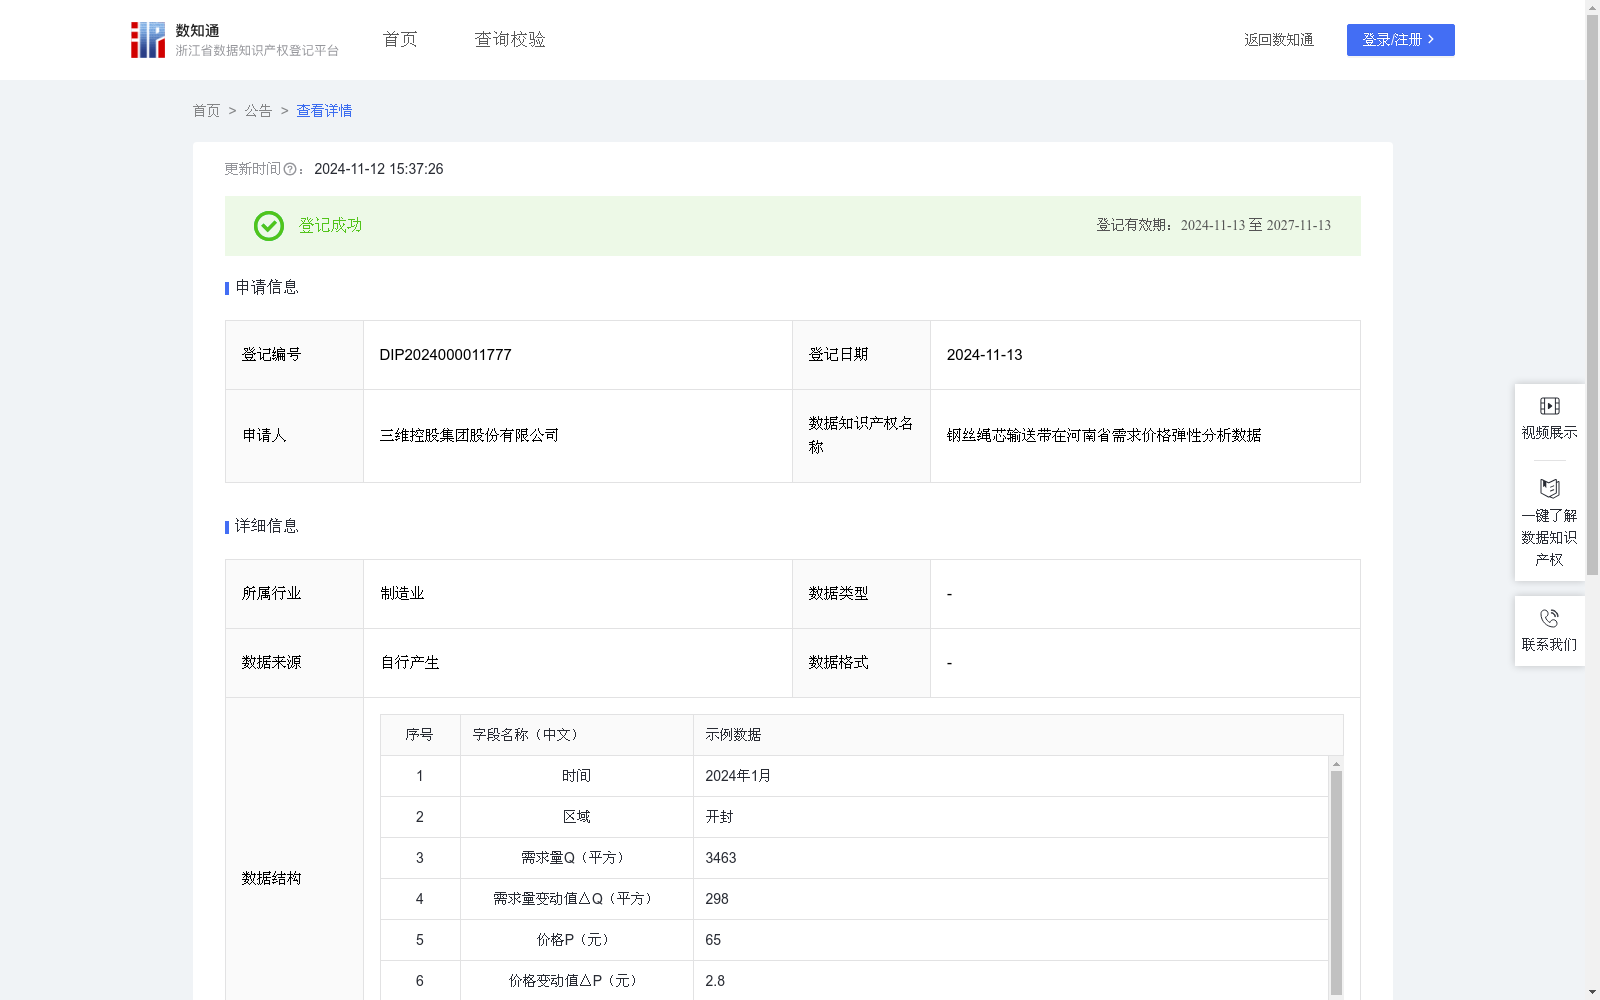
钢丝绳芯输送带在河南省需求价格弹性分析数据
收藏浙江省数据知识产权登记平台2024-11-12 更新2024-11-13 收录
下载链接:
https://www.zjip.org.cn/home/announce/trends/83646
下载链接
链接失效反馈官方服务:
资源简介:
为更好得了解河南省各市县对钢丝绳芯输送带的市场需求情况,对相关钢丝绳芯输送带需求弹性数据进行采集计算。相关行业的企业可以根据本数据分析的结果制定营销策略。如果钢丝绳芯输送带需求量变动的比率大于价格变动的比率,那么钢丝绳芯输送带需求富有弹性,说明顾客对于钢丝绳芯输送带价格变化的敏感程度大,弹性越大,需求对价格变化越敏感,本行业所有企业可以在该市适当的降低钢丝绳芯输送带价格来提高销量,获得较多的收益。如果钢丝绳芯输送带需求缺乏弹性,本行业相关企业可以在该市适当的提高钢丝绳芯输送带价格来提高价格,打造品牌效应。该项数据对本行业所有企业在河南省的市场营销决策有重要参考价值。1.数据采集:采集相关钢丝绳芯输送带在某一时间段河南省的的需求数据和价格数据,按照市级进行整理归纳,得到该钢丝绳芯输送带的需求量变动数值和价格变化数值。 2.算法规则:对采集得到的数据按照如下公式进行计算:需求弹性系数|Ed|=|(△Q/Q)÷(△P/P)|,得到需求弹性系数。式中:Q表示产品的需求量,单位为份;P表示产品的价格,单位为元;△Q表示需求量变动值,单位为份;△P表示价格变动值,单位为元。取需求弹性系数的绝对值|Ed|作为分析数据时的参考系数。 3.数据分析:根据|Ed|的数值可分析该钢丝绳芯输送带的需求价格弹性。(1)|Ed|=1(单位需求价格弹性),说明需求量变动幅度与价格变动幅度相同;(2)1<|Ed|(需求富有弹性),说明需求量变动幅度大于价格变动幅度;(3)|Ed|<1(需求缺乏弹性),说明需求量变动幅度小于价格变动幅度。
To better understand the market demand for steel cord conveyor belts across cities and counties in Henan Province, relevant demand elasticity data of steel cord conveyor belts were collected and calculated. Enterprises in related industries can develop marketing strategies based on the results of this data analysis. If the ratio of changes in demand for steel cord conveyor belts is greater than the ratio of price changes, the demand for steel cord conveyor belts is price elastic, indicating that customers are highly sensitive to price changes of steel cord conveyor belts. The greater the elasticity, the more sensitive demand is to price changes. All enterprises in this industry can appropriately lower the price of steel cord conveyor belts in the corresponding city to increase sales and obtain higher revenues. If the demand for steel cord conveyor belts is price inelastic, relevant enterprises in this industry can appropriately raise the price of steel cord conveyor belts in the corresponding city to increase total revenues and build brand effects. This data has important reference value for all enterprises in this industry when making marketing decisions in Henan Province.
1. Data Collection: Collect demand and price data of steel cord conveyor belts in Henan Province over a certain period of time, organize and summarize them at the municipal level to obtain the changes in demand quantity and price changes of steel cord conveyor belts.
2. Algorithm Rules: Calculate the collected data using the following formula: the demand elasticity coefficient |Ed| = |(ΔQ/Q) ÷ (ΔP/P)|. In this formula, Q represents the demand quantity of the product (unit: unit), P represents the price of the product (unit: yuan), ΔQ represents the change in demand quantity (unit: unit), and ΔP represents the change in price (unit: yuan). The absolute value of the demand elasticity coefficient |Ed| is taken as the reference coefficient for data analysis.
3. Data Analysis: The price elasticity of demand for steel cord conveyor belts can be analyzed based on the value of |Ed|:
(1) |Ed| = 1 (unitary price elasticity of demand): indicating that the magnitude of change in demand is the same as that of price change;
(2) 1 < |Ed| (price elastic demand): indicating that the magnitude of change in demand is greater than that of price change;
(3) |Ed| < 1 (price inelastic demand): indicating that the magnitude of change in demand is smaller than that of price change.
提供机构:
三维控股集团股份有限公司
创建时间:
2024-10-17
搜集汇总
数据集介绍
以上内容由遇见数据集搜集并总结生成


