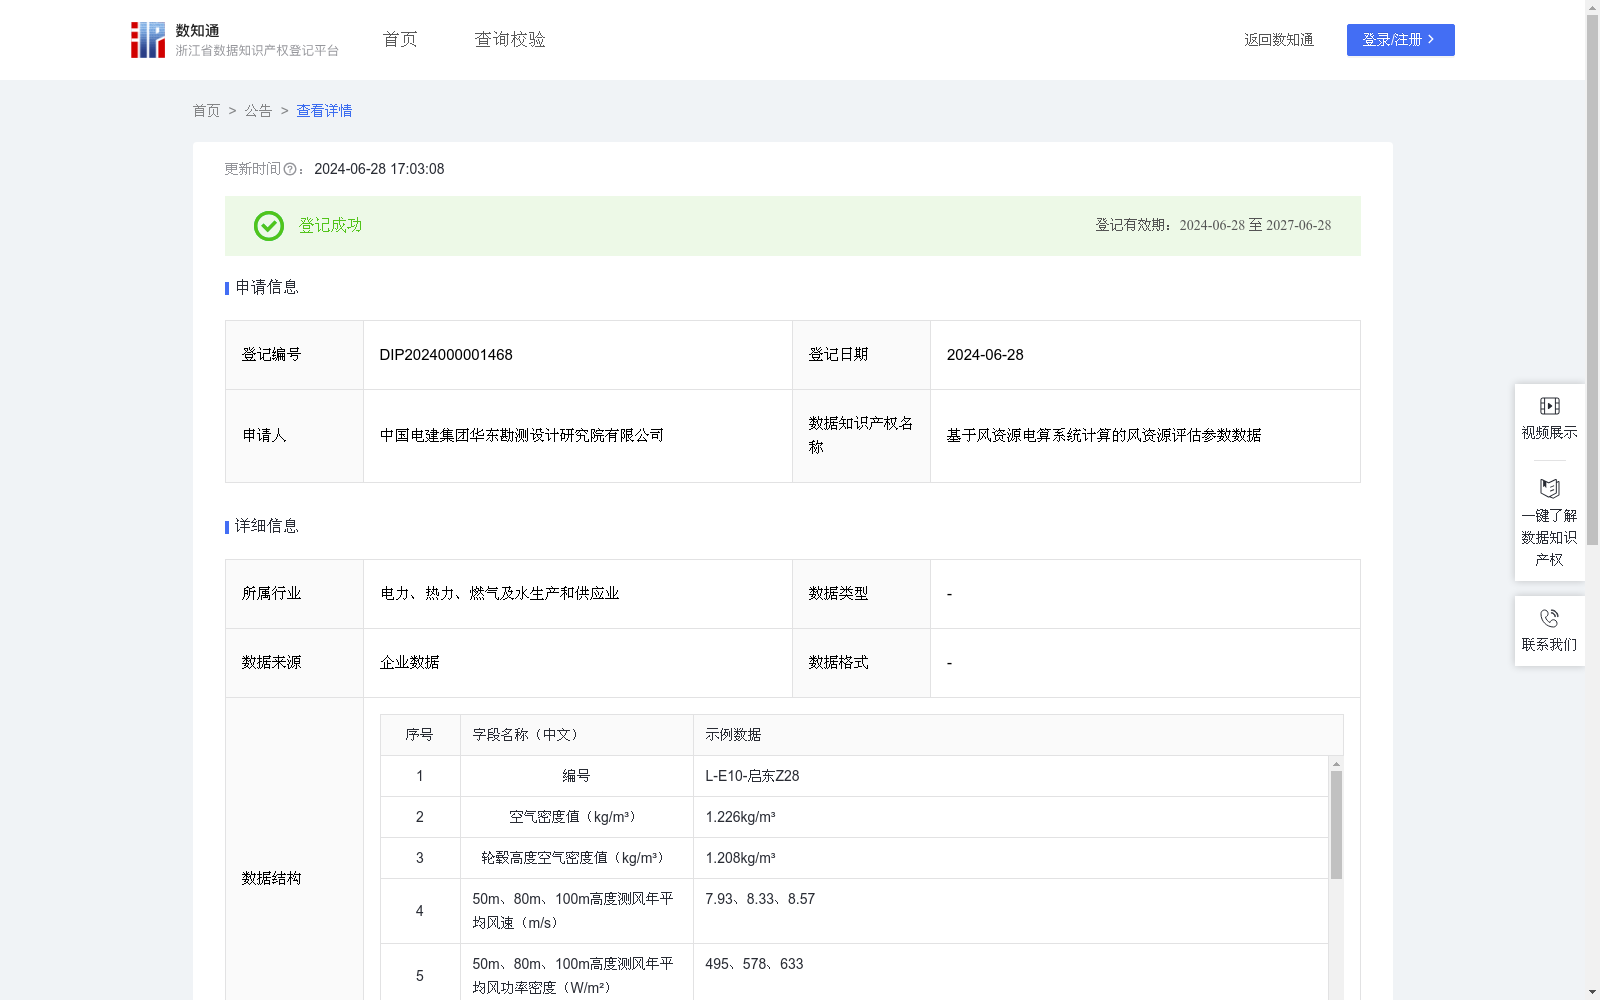
基于风资源电算系统计算的风资源评估参数数据
收藏浙江省数据知识产权登记平台2024-06-28 更新2024-06-29 收录
下载链接:
https://www.zjip.org.cn/home/announce/trends/35650
下载链接
链接失效反馈官方服务:
资源简介:
用于风电场开发前期评估风电场运行期内20/25年风能资源参数水平,比如,现行海上项目特别关注高度(50m、80m、100m)下的测风年平均风速、风功率密度值及其威布尔分布参数(k\c值);现行海上项目特别关注高度(50m、80m、100m)下的代表年平均风速、风功率密度值及其威布尔分布参数(k\c值);拟合切变指数、平均湍流强度、70%分位数湍流强度值。收集L-Z28激光雷达10min原始数据,经数据筛洗,采用分16象限相关插补方法处理缺测及不合理数据风速或风向数据,得到Z28激光雷达测风年平均风速和测风年威布尔K,C参数(如统计的50m、80m、100m高度)。根据Z28实测气温、气压,由气象公式计算空气密度值并推算至轮毂高度,根据风速和轮毂高度空气密度值计算各风功率密度。根据再分析数据分析测风塔代表年:Z28位置ERA5再分析数据30年长系列风速为7.70m/s,ERA5再分析数据在Z28激光雷达测风年时段平均风速为8.24m/s;参考长系列与测风年风速差,按照分16扇区相关订正的方法,订正得代表年修正后各高度代表年(风电场运行20/25年具有长期代表性)风速分、代表年威布尔K,C参数、代表年风功率密度。按照16风向扇区统计分析激光雷达主导风向为NNE、S、N。根据测风塔同朝向高度同期有效数据,拟合垂直方向风切变指数为0.0887。湍流强度计算方式为每个10min时刻的风速标准偏差(SD值)除以风速每个10min时刻的平均风速值,基于10min有效数据(数据筛洗后)统计Z18实测高度的平均湍流强度、70%分位数湍流强度。完成整编。
This dataset is used for pre-development assessment of wind energy resource parameters over the 20/25-year operational period of a wind farm. For example, current offshore wind projects specifically focus on the annual measured wind speed, wind power density, and Weibull distribution parameters (k and c values) at heights of 50 m, 80 m, and 100 m; they also prioritize the representative annual wind speed, wind power density, and Weibull distribution parameters (k and c values) at the same three heights. The dataset also involves fitting the wind shear exponent, average turbulence intensity, and 70th percentile turbulence intensity. Raw 10-minute data from the L-Z28 lidar is collected, followed by data screening. Missing and unreasonable wind speed or direction data are processed using the 16-quadrant correlation interpolation method, to obtain the annual measured wind speed and annual measured Weibull k and c parameters (for the 50 m, 80 m, and 100 m heights, as statistically calculated) of the Z28 lidar. Based on the measured air temperature and pressure from the Z28 lidar, air density values are calculated using meteorological formulas and extrapolated to the hub height. Wind power densities at various heights are then calculated using the wind speed and the extrapolated air density at hub height. The representative year of the wind measurement tower is analyzed based on reanalysis data: the 30-year long-term average wind speed from ERA5 reanalysis data at the Z28 lidar location is 7.70 m/s, while the average wind speed of ERA5 reanalysis data during the Z28 lidar's measurement period is 8.24 m/s. Referencing the wind speed difference between the long-term series and the measurement year, the 16-sector correlation correction method is applied to obtain the corrected representative annual wind speed, Weibull k and c parameters, and wind power density at each height for the representative year, which has long-term representativeness for the 20/25-year operational period of the wind farm. Statistical analysis based on 16 wind direction sectors shows that the dominant wind directions of the lidar are NNE, S, and N. Based on valid concurrent data at the same height and orientation of the wind measurement tower, the vertical wind shear exponent is fitted to be 0.0887. Turbulence intensity is calculated as the wind speed standard deviation (SD value) at each 10-minute interval divided by the average wind speed at that 10-minute interval. Based on the valid 10-minute data (after data screening), the average turbulence intensity and 70th percentile turbulence intensity at the measured heights of the Z18 lidar are statistically calculated. Data compilation is finalized.
提供机构:
中国电建集团华东勘测设计研究院有限公司
创建时间:
2024-05-27
搜集汇总
数据集介绍
特点
该数据集为风电场开发提供关键风能资源评估参数,包含多高度层风速、风功率密度及威布尔分布等专业指标,数据来源可靠且经过严格算法处理,适用于海上风电项目前期可行性分析。
以上内容由遇见数据集搜集并总结生成


