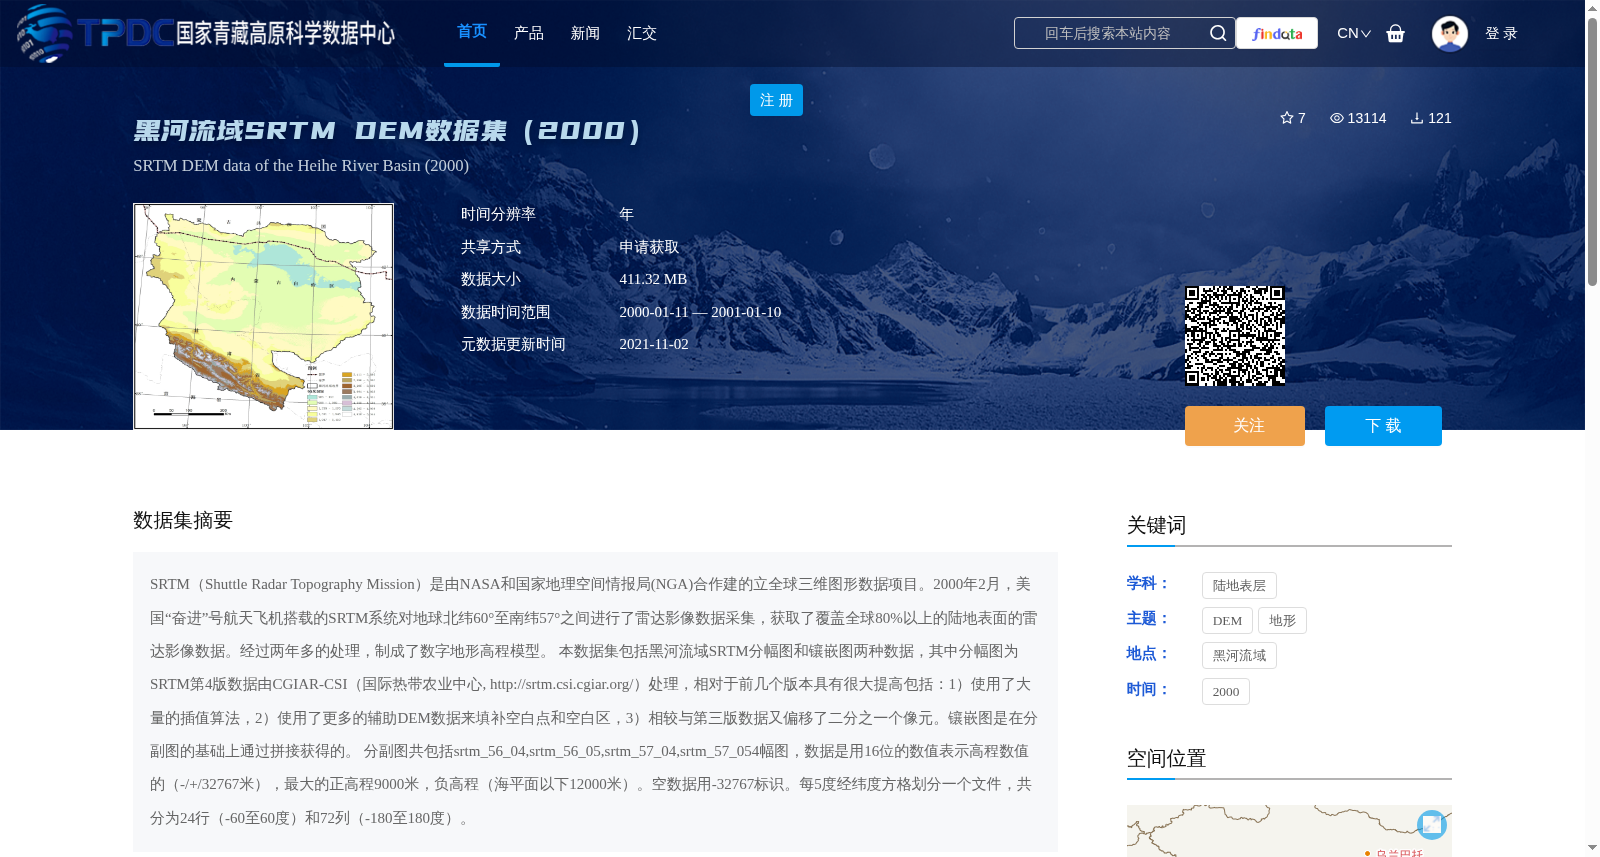
黑河流域SRTM DEM数据集(2000)
收藏资源简介:
SRTM(Shuttle Radar Topography Mission)是由NASA和国家地理空间情报局(NGA)合作建的立全球三维图形数据项目。2000年2月,美国“奋进”号航天飞机搭载的SRTM系统对地球北纬60°至南纬57°之间进行了雷达影像数据采集,获取了覆盖全球80%以上的陆地表面的雷达影像数据。经过两年多的处理,制成了数字地形高程模型。 本数据集包括黑河流域SRTM分幅图和镶嵌图两种数据,其中分幅图为SRTM第4版数据由CGIAR-CSI(国际热带农业中心, http://srtm.csi.cgiar.org/)处理,相对于前几个版本具有很大提高包括:1)使用了大量的插值算法,2)使用了更多的辅助DEM数据来填补空白点和空白区,3)相较与第三版数据又偏移了二分之一个像元。镶嵌图是在分副图的基础上通过拼接获得的。 分副图共包括srtm_56_04,srtm_56_05,srtm_57_04,srtm_57_054幅图,数据是用16位的数值表示高程数值的(-/+/32767米),最大的正高程9000米,负高程(海平面以下12000米)。空数据用-32767标识。每5度经纬度方格划分一个文件,共分为24行(-60至60度)和72列(-180至180度)。
SRTM (Shuttle Radar Topography Mission) is a global 3D geospatial data project jointly developed by NASA and the National Geospatial-Intelligence Agency (NGA). In February 2000, the SRTM system aboard the U.S. Space Shuttle Endeavour conducted radar image data acquisition between 60° North latitude and 57° South latitude, obtaining radar image data covering more than 80% of the global land surface. After over two years of processing, a digital elevation model (DEM) was produced. This dataset includes two types of data for the Heihe River Basin: SRTM segmented tiles and mosaic maps. The segmented tiles are the 4th version of SRTM data processed by CGIAR-CSI (International Center for Tropical Agriculture, http://srtm.csi.cgiar.org/), which has significant improvements over previous versions, including: 1) The application of a large number of interpolation algorithms; 2) The use of additional auxiliary DEM data to fill voids and blank areas; 3) A half-pixel offset compared to the 3rd version of the data. The mosaic map is generated by stitching the segmented tiles together. The segmented tiles consist of a total of 4 maps: srtm_56_04, srtm_56_05, srtm_57_04, and srtm_57_05. Elevation values are represented by 16-bit signed integers, with a value range of -32767 to +32767 meters. The maximum positive elevation is 9000 meters, and the minimum negative elevation (below sea level) is 12000 meters. No-data values are denoted by -32767. Each file corresponds to a 5°×5° latitude-longitude grid, with a total of 24 rows (spanning -60° to 60° latitude) and 72 columns (spanning -180° to 180° longitude).