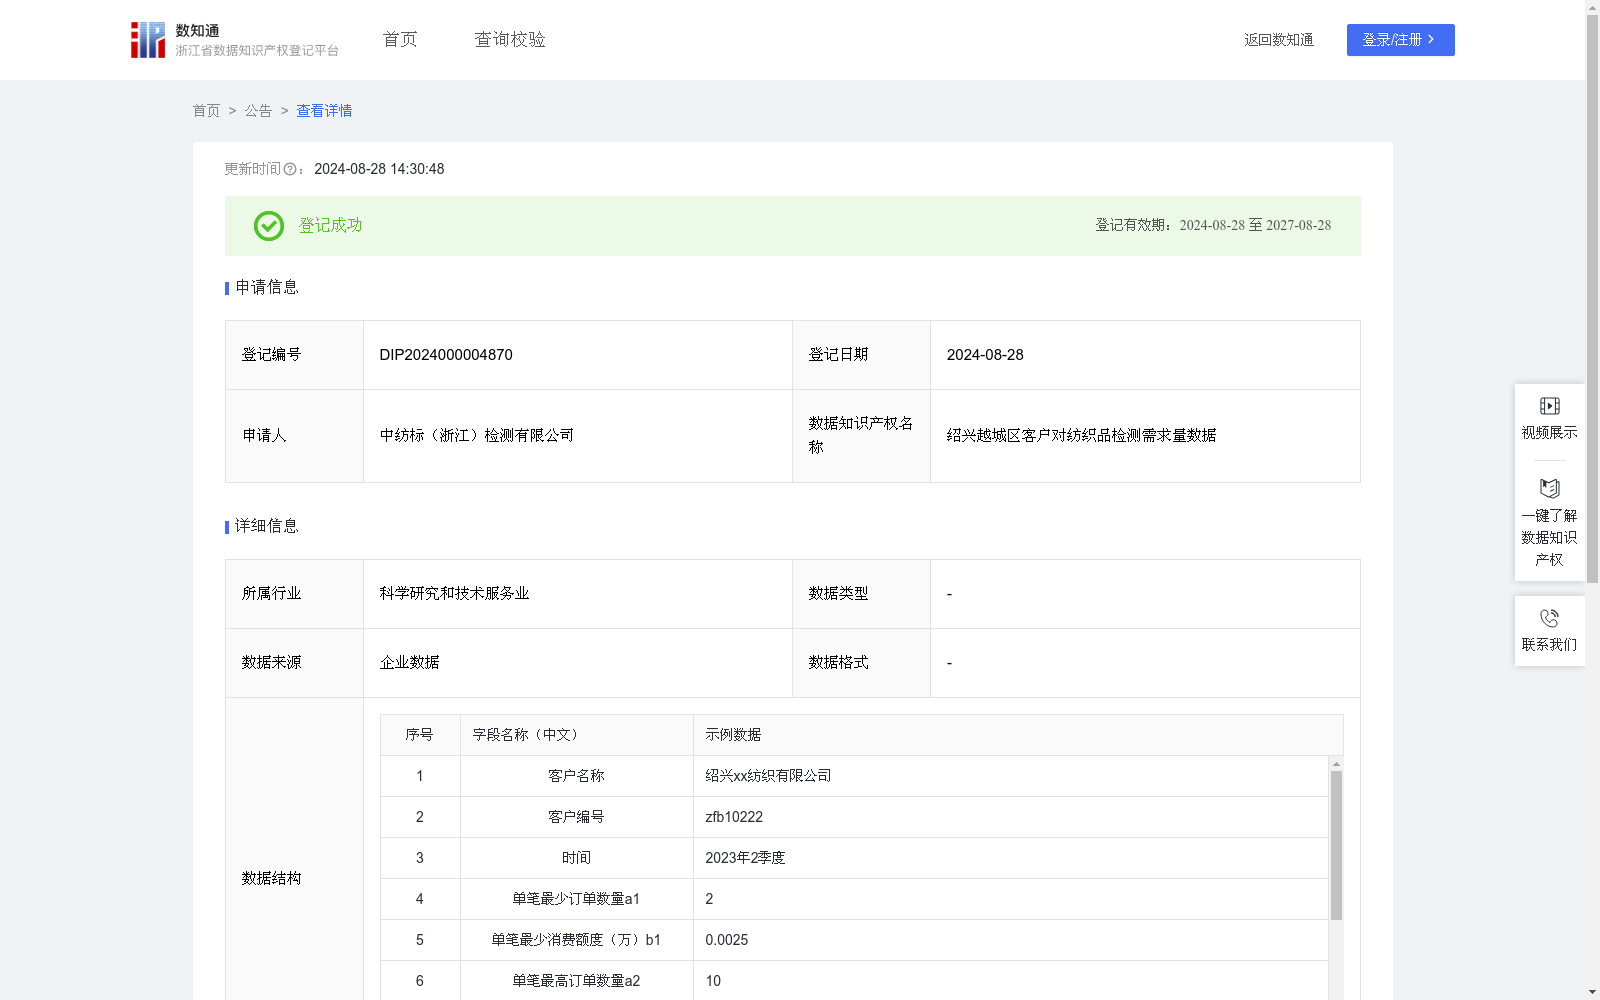
绍兴越城区客户对纺织品检测需求量数据
收藏浙江省数据知识产权登记平台2024-08-28 更新2024-08-29 收录
下载链接:
https://www.zjip.org.cn/home/announce/trends/55415
下载链接
链接失效反馈官方服务:
资源简介:
通过收集和分析绍兴越城区客户对纺织品检测消费相关数据,了解客户对纺织品检测的购买力水平和消费偏好,从而了解该产品是否畅销,从而为本行业的所有企业制定生产策略,更好地为用户提供个性化的商品和服务。1.数据采集:采集平时客户对纺织品检测的相关交易数据。2.数据处理:对采集到数据进行分类、合并、累加,便于分析使用。3.算法加工:将处理后的数据进行需求量分析:P={a1(单笔最少订单数量)/b1(单笔最少消费额度)+a2(单笔最高订单数量)/b2(单笔最高消费额度)+a3(平均订单数量)/b3(平均消费额度)}*k,k为消费系数,不同地区系数大小值不同,按经验取值越城区k值为0.7。4、数据分类分级:根据计算出的需求量水平,将客户等级划分为“高、中、低”不同的类别和级别(500分以上标记为“高等级”,200-500分区间内标记为“中等级”,200分以下标记为“低等级”),帮助公司更好地理解客户,高等级企业可每月1至2次与企业沟通,中等级可每季度1至2次与企业沟通,低等级企业可每半年1至2次与企业沟通,从而制定更精准的生产营销策略。
This dataset is developed by collecting and analyzing consumer-related data on textile testing services from customers in Yuecheng District, Shaoxing, to gain insights into customers' purchasing power and consumption preferences for such services, evaluate the market popularity of textile testing services, and assist all enterprises in the industry in formulating production strategies to better provide users with personalized products and services.
1. Data Collection: Gather daily transaction data related to textile testing services from customers.
2. Data Preprocessing: Classify, merge, and accumulate the collected data to facilitate subsequent analytical use.
3. Algorithm-based Demand Analysis: Apply the following formula to the preprocessed data for demand calculation:
$P = left( frac{a_1}{b_1} + frac{a_2}{b_2} + frac{a_3}{b_3}
ight) imes k$
Where $a_1$ denotes the minimum single-order quantity, $b_1$ denotes the minimum single-order consumption amount; $a_2$ denotes the maximum single-order quantity, $b_2$ denotes the maximum single-order consumption amount; $a_3$ denotes the average single-order quantity, $b_3$ denotes the average single-order consumption amount. $k$ is the consumption coefficient that varies across regions; the empirically set value of $k$ for Yuecheng District is 0.7.
4. Data Classification and Grading: Segment customers into three tiers — "High", "Medium", and "Low" — based on the calculated demand score $P$: customers with a score above 500 are labeled as "High Tier", those with scores within the range of 200 to 500 are labeled as "Medium Tier", and those with a score below 200 are labeled as "Low Tier". This classification helps enterprises gain a better understanding of their customer base: enterprises in the High Tier can be contacted 1 to 2 times per month, those in the Medium Tier 1 to 2 times per quarter, and those in the Low Tier 1 to 2 times every six months, so as to formulate more precise production and marketing strategies.
提供机构:
中纺标(浙江)检测有限公司
创建时间:
2024-08-03
搜集汇总
数据集介绍
特点
该数据集记录了绍兴越城区纺织品检测客户的详细需求数据,包括订单数量、消费额度和需求指数等,通过算法分析客户等级,用于企业制定精准营销策略。
以上内容由遇见数据集搜集并总结生成


