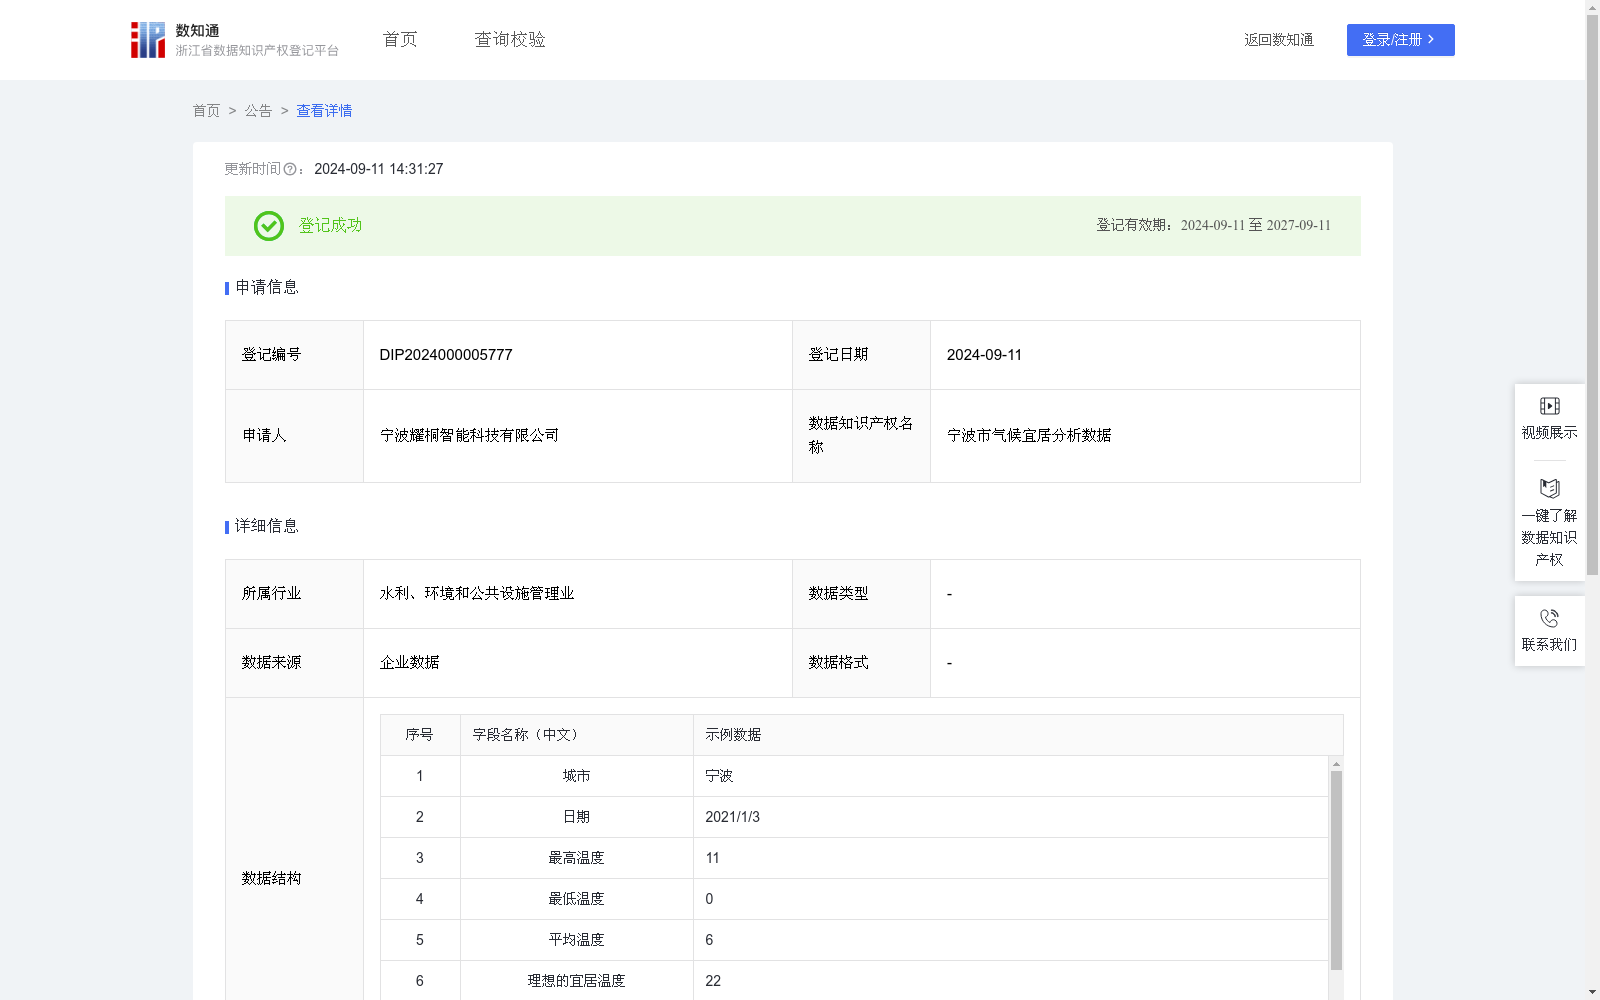
宁波市气候宜居分析数据
收藏浙江省数据知识产权登记平台2024-09-11 更新2024-09-12 收录
下载链接:
https://www.zjip.org.cn/home/announce/trends/60096
下载链接
链接失效反馈官方服务:
资源简介:
基于DHI的历史数据,可以为城市管理者提供气候舒适度的等级评价,并为未来的城市发展规划提供科学依据。气候舒适度分析和DHI评价不仅能帮助居民了解某些时段的生活舒适度,还可以为政府和城市规划者提供决策依据。例如,在夏季炎热月份,可以加大绿地建设和遮阳设施的投入;而在冬季寒冷时段,可以提前制定供暖和防寒措施。通过对历史数据的分析,还可以预测未来可能的气候变化趋势,从而更好地应对城市宜居性挑战。为了计算每日天气温度的宜居指数并划分舒适等级,计算每日宜居指数(Daily Habitable Index, DHI),然后根据指数值划分舒适等级。量化每个气象因素(如温度)对舒适度的影响。 每日宜居指数(DHI)计算公式: DHI=((1−|Tavg−Topt|÷Trange)×0.5+(1−|Tmax−Topt|÷Trange)×0.25+(1−|Tmin−Topt|÷Trang)×0.25)×100
其中:Tavg 是当天平均温度;Tmax是当天最高温度;Tmin 是当天最低温度;Topt是理想宜居温度(例如22°C);Trange是允许最大温度偏差范围(例如15°C);权重为0.5、0.25、0.25,分别用于平均、最高和最低温度的权重。在计算宜居指数时,如果某一部分的计算结果小于零,则将其设为零,通过 max(0, ...) 来实现的。 根据DHI值,将舒适等级划分为以下几个等级:非常舒适: DHI > 80 舒适: 60 < DHI ≤ 80 一般: 40 < DHI ≤ 60 不舒适: 20 < DHI ≤ 40 非常不舒适: DHI ≤ 20。
Based on historical DHI-related data, this resource can provide hierarchical evaluations of climatic comfort for urban managers, and offer scientific support for future urban development planning. Climatic comfort analysis and DHI evaluation can not only help residents understand the living comfort during specific periods, but also provide decision-making references for governments and urban planners. For example, during hot summer months, investment in green space construction and shading facilities can be increased; while in cold winter periods, heating and cold prevention measures can be formulated in advance. Through the analysis of historical data, future climate change trends can also be predicted, so as to better address challenges related to urban livability. To calculate the daily weather temperature livability index and classify comfort levels, the Daily Habitable Index (DHI) is first computed for each day, followed by comfort level division based on the index values. The impact of each meteorological factor (such as temperature) on comfort is quantified. The formula for calculating the Daily Habitable Index (DHI) is: DHI = [(1 − |Tavg − Topt| ÷ Trange) × 0.5 + (1 − |Tmax − Topt| ÷ Trange) × 0.25 + (1 − |Tmin − Topt| ÷ Trange) × 0.25] × 100. Where: Tavg is the daily average temperature; Tmax is the daily maximum temperature; Tmin is the daily minimum temperature; Topt is the ideal livable temperature (e.g., 22°C); Trange is the allowable maximum temperature deviation range (e.g., 15°C); the weights of 0.5, 0.25 and 0.25 are respectively assigned to the average, maximum and minimum temperatures. When calculating the livability index, if the calculation result of any term is less than zero, it will be set to zero via the max(0, ...) operation. According to the DHI value, the comfort levels are divided into the following categories: Very Comfortable: DHI > 80; Comfortable: 60 < DHI ≤ 80; General: 40 < DHI ≤ 60; Uncomfortable: 20 < DHI ≤ 40; Extremely Uncomfortable: DHI ≤ 20.
提供机构:
宁波耀桐智能科技有限公司
创建时间:
2024-08-15
搜集汇总
数据集介绍
特点
宁波市气候宜居分析数据包含1096条记录,涵盖温度、宜居指数和舒适等级评价等关键气候指标,适用于城市规划和气候舒适度分析,每年更新一次。
以上内容由遇见数据集搜集并总结生成


