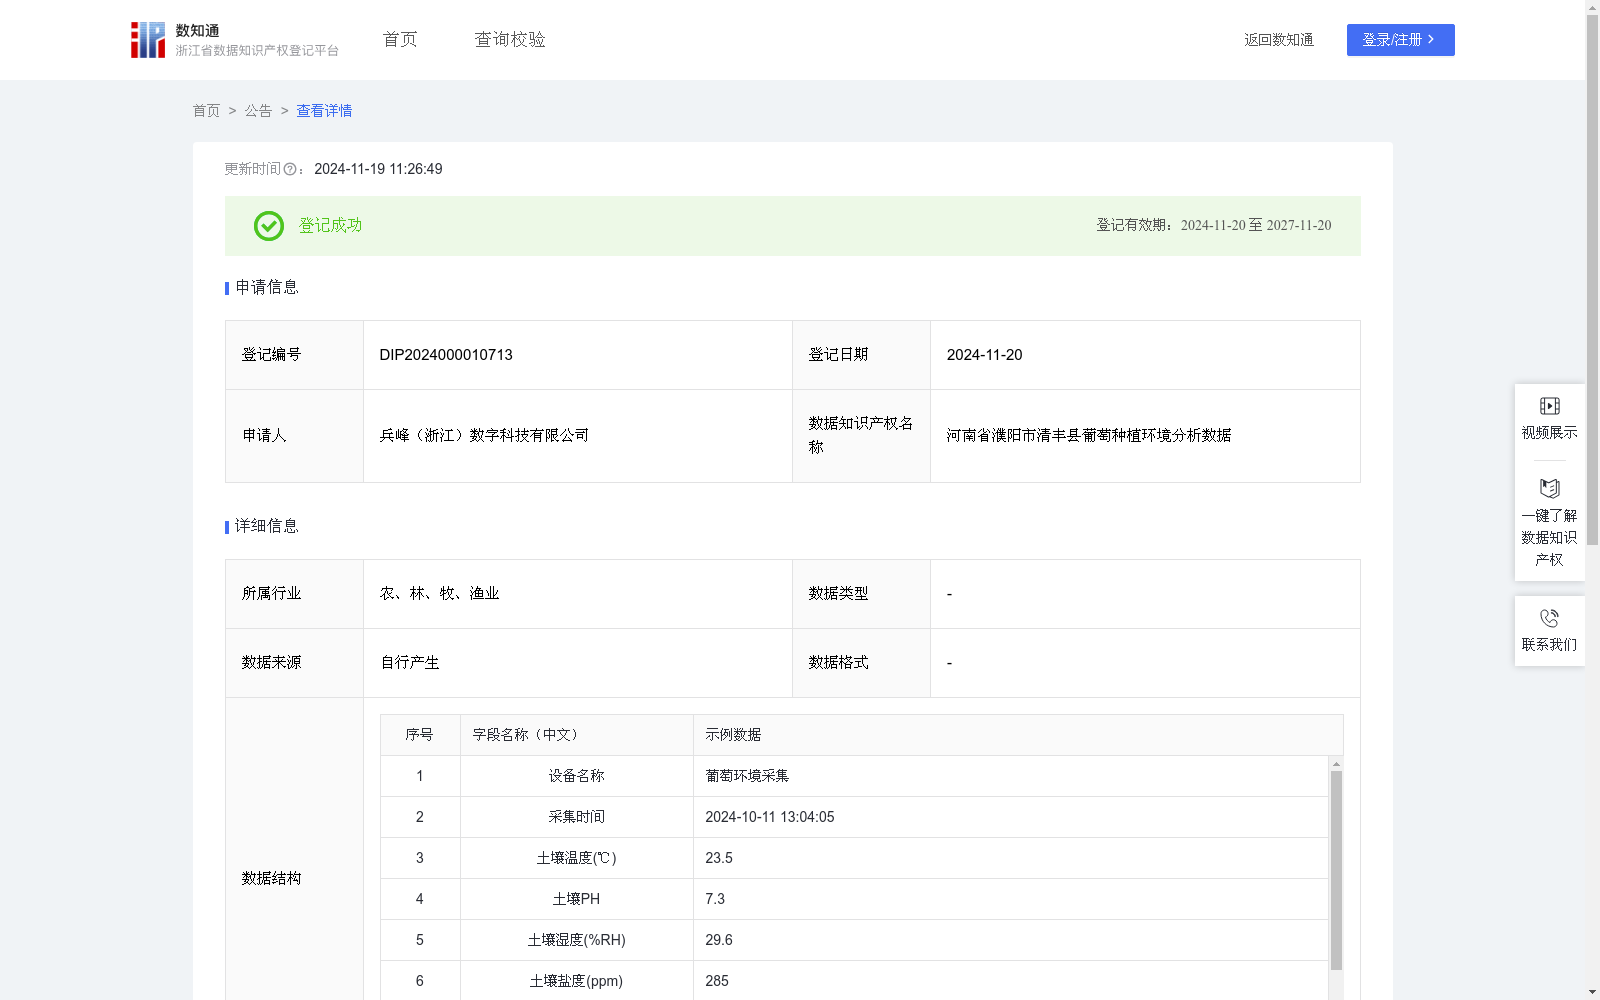
河南省濮阳市清丰县葡萄种植环境分析数据
收藏浙江省数据知识产权登记平台2024-11-19 更新2024-11-20 收录
下载链接:
https://www.zjip.org.cn/home/announce/trends/86184
下载链接
链接失效反馈官方服务:
资源简介:
采集葡萄种植的土壤湿温度、土壤盐度、土壤PH、土壤电导率等数据,这些数据综合反映了土壤环境对葡萄生长的影响,是精准农业管理的基础。土壤湿度与温度直接影响葡萄根系的吸收能力和生长速度,确保合理灌溉与通风;土壤盐度(电导率)监控盐分积累,避免盐碱化影响植株健康;土壤pH值则关乎养分有效性,指导施肥策略以平衡土壤酸碱度。综合这些数据,种植者能科学调整管理措施,如灌溉、施肥与土壤改良,从而优化葡萄生长环境,提升果实品质与产量。同时,长期监测还有助于预防病虫害,促进农业可持续发展。1.数据采集:通过土壤PH传感器、土壤盐度传感器、土壤电导率传感器、土壤温湿度传感器等物联网设备,结合4G/5G、Wi-Fi与有线网络,实时采集种植环境中的土壤PH、土壤盐度、土壤电导率、土壤温湿度等多维数据。
2.算法规则:系统采用环境参数评分算法,对环境数据进行评分。基于作物生长理想条件(如土壤PH、土壤盐度、土壤电导率、土壤温湿度等),并通过以下公式计算:环境参数评分=100-Σ(w_i×|当前值_i-理想值_i|/容差_i)其中,Σ表示对所有参数的累加,w_i是第i个参数的权重。当前值_i是第i个参数的实际测量值,理想值_i是第i个参数的理想值。容差_i是第i个参数的允许波动范围。权重、理想值和容差范围设定基于历史数据分析以及实际种植经验的确定。对作物生长影响较大的参数获得较高的权重。容差范围则考虑到环境因素的波动性,针对作物对不同环境变化的耐受性设定进行适当设定,环境参数偏离理想值越多,扣分越大,以土壤湿度为例,其权重为3,理想值设定为70,容差范围为±10,扣分计算如下:土壤湿度扣分=3×|29.6-70|/10=3×4.04=12.12。根据评分生成具体的环境优化方案。
This dataset collects data such as soil temperature and moisture, soil salinity, soil pH, and soil electrical conductivity from grape cultivation. These data comprehensively reflect the impact of soil environment on grape growth, and serve as the foundation for precision agricultural management. Soil moisture and temperature directly affect the nutrient uptake capacity and growth rate of grape roots, enabling proper irrigation and ventilation; soil salinity (electrical conductivity) monitors salt accumulation to avoid salinization harming plant health; soil pH is related to nutrient availability, guiding fertilization strategies to balance soil pH levels. By integrating these data, growers can scientifically adjust management practices such as irrigation, fertilization, and soil amendment, thereby optimizing the growing environment for grapes and improving fruit quality and yield. Additionally, long-term monitoring helps prevent pests and diseases, promoting sustainable agricultural development.
1. Data Collection: Multi-dimensional data including soil pH, soil salinity, soil electrical conductivity, and soil temperature and moisture in the cultivation environment are collected in real time via IoT devices such as soil pH sensors, soil salinity sensors, soil electrical conductivity sensors, and soil temperature and moisture sensors, combined with 4G/5G, Wi-Fi, and wired networks.
2. Algorithm Rules: The system adopts an environmental parameter scoring algorithm to evaluate environmental data. The score is calculated based on the optimal conditions for crop growth (such as soil pH, soil salinity, soil electrical conductivity, and soil temperature and moisture) using the following formula:
Environmental Parameter Score = 100 - Σ(w_i × |Current Value_i - Optimal Value_i| / Tolerance_i)
Where Σ represents the sum over all parameters, w_i is the weight of the i-th parameter, Current Value_i is the actual measured value of the i-th parameter, Optimal Value_i is the ideal optimal value of the i-th parameter, and Tolerance_i is the allowable fluctuation range of the i-th parameter. The weights, optimal values, and tolerance ranges are determined based on historical data analysis and actual cultivation experience. Parameters with greater impact on crop growth are assigned higher weights. The tolerance ranges are appropriately set considering the volatility of environmental factors and the crop's tolerance to different environmental changes. The more the environmental parameter deviates from the optimal value, the greater the deduction. Take soil moisture as an example: its weight is set to 3, the optimal value is 70, and the tolerance range is ±10. The deduction for soil moisture is calculated as:
Soil Moisture Deduction = 3 × |29.6 - 70| / 10 = 3 × 4.04 = 12.12
Specific environmental optimization schemes are generated based on the calculated scores.
提供机构:
兵峰(浙江)数字科技有限公司
创建时间:
2024-10-08
搜集汇总
数据集介绍
以上内容由遇见数据集搜集并总结生成


