adaption-charts-p2-gold
收藏资源简介:
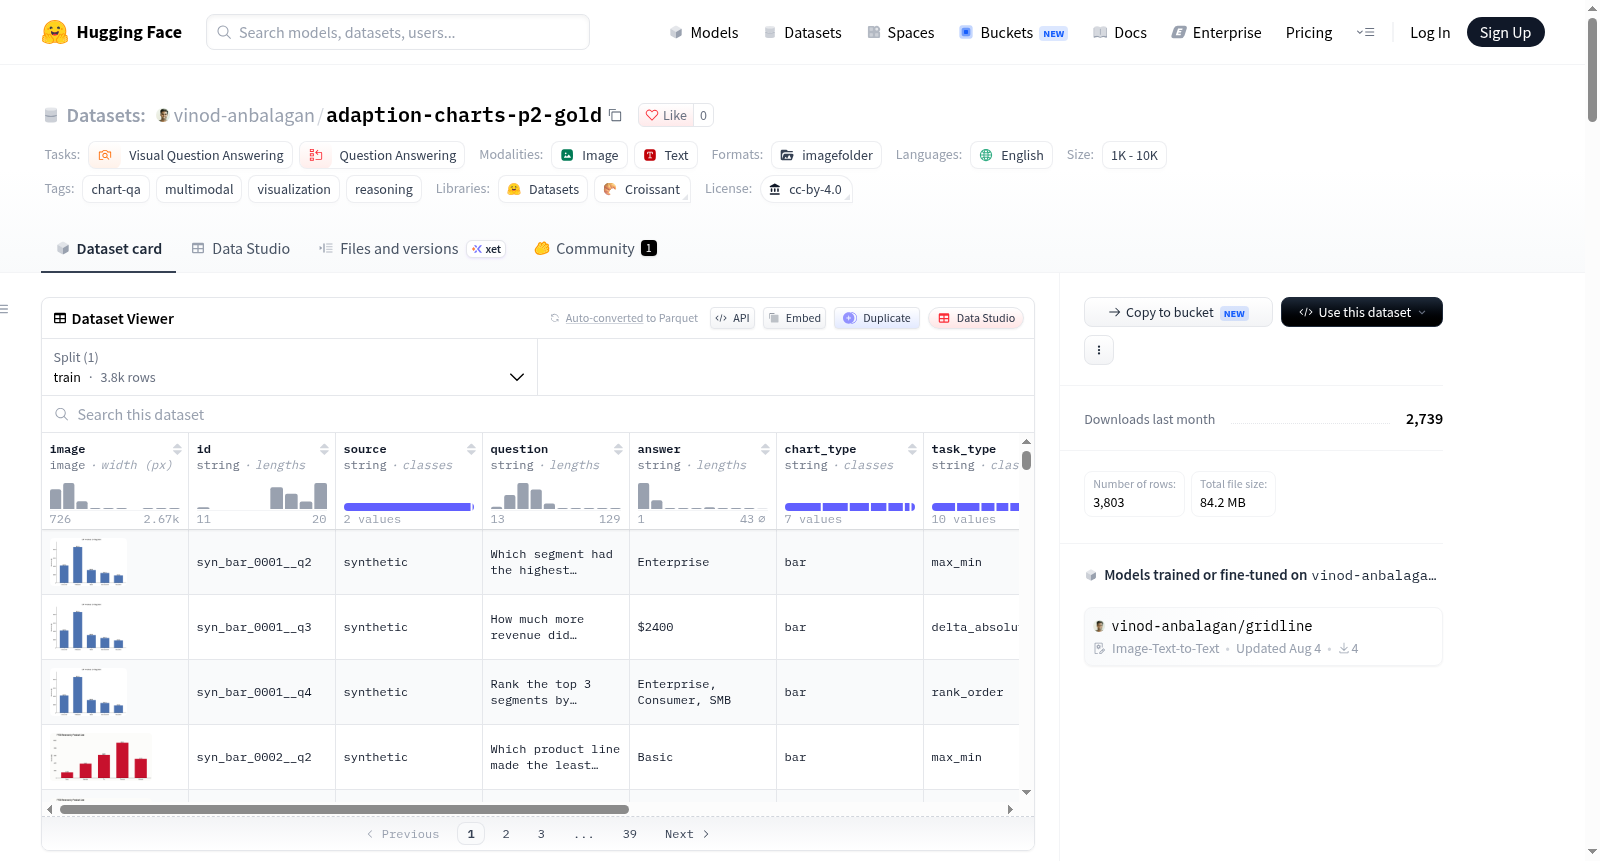
Adaption Charts P2 — Gold Chart-QA 是一个高质量的图表问答数据集,专为 Adaption Labs AutoScientist 挑战赛(第二部分,数据可视化赛道)构建。数据集包含两部分来源:程序化生成的合成核心(正确性由构造保证)和基于真实公共仪表板与报告手工编写的硬集。总计1100条样本,其中1002条为合成数据,98条为硬集数据。每条样本包含11个字段:file_name(图表PNG路径)、id(唯一ID)、source(synthetic或hardset)、question(问题)、answer(答案)、chart_type(图表类型,共7种:bar、line、grouped_bar、stacked_bar、pie、donut、mixed)、task_type(任务类型,共10种:lookup_value、delta_absolute、max_min、rank_order、compare_categories、aggregation_sum_avg、multi_series_compare、trend_direction、percent_change_ratio、hard_multi_step)、difficulty(难度:easy、medium、hard)、verified(布尔值,所有行均为true)、split(全部为train)、notes(出处/归属/生成器注释)。所有样本均经过验证:合成数据基于确定性种子预计算答案,保证正确;硬集数据由人工逐条审核,确保答案可从图表图像中独立得出。数据集覆盖英语,领域包括商业、金融、健康、政策等。适用于微调多模态图表问答模型、图表理解基准测试、图表类型或任务类型的消融研究。已知限制包括仅英语、合成图表风格统一、硬集偏向max_min和lookup_value、mixed图表仅存在于硬集、本文件不含验证/测试集。数据集采用CC-BY-4.0许可。
Adaption Charts P2 — Gold Chart-QA is a high-quality chart question answering dataset constructed for the Adaption Labs AutoScientist Challenge (Part 2, Data Visualization Track). The dataset comprises two sources: a programmatically generated synthetic core (with correctness guaranteed by its construction method) and a hardset manually crafted based on real-world public dashboards and reports. In total, there are 1100 samples, including 1002 synthetic samples and 98 hardset samples. Each sample contains 11 fields: 1. `file_name`: File path to the chart PNG image 2. `id`: Unique sample ID 3. `source`: Indicates the sample origin, either `synthetic` or `hardset` 4. `question`: The question text for the chart 5. `answer`: The correct answer to the corresponding question 6. `chart_type`: Chart type, with 7 supported categories: bar, line, grouped_bar, stacked_bar, pie, donut, mixed 7. `task_type`: Task type, with 10 supported categories: lookup_value, delta_absolute, max_min, rank_order, compare_categories, aggregation_sum_avg, multi_series_compare, trend_direction, percent_change_ratio, hard_multi_step 8. `difficulty`: Difficulty level, with three options: easy, medium, hard 9. `verified`: Boolean value, all entries are set to `true` 10. `split`: All entries are set to `train` 11. `notes`: Provenance, attribution or generator annotations All samples have undergone verification: synthetic data precomputes answers based on deterministic seeds to ensure full correctness; hardset data has been manually reviewed item-by-item to confirm that answers can be independently derived from the chart images. The dataset covers English language, with application domains including business, finance, healthcare, policy and others. It is applicable for fine-tuning multimodal chart question answering models, chart understanding benchmark testing, and ablation studies on chart types or task types. Known limitations include: only supporting English, uniform style of synthetic charts, hardset samples being biased towards max_min and lookup_value tasks, mixed charts only existing in the hardset, and this file does not contain validation or test splits. The dataset is licensed under CC-BY-4.0.
数据集概述
Adaption Charts P2 — Gold Chart-QA 是一个面向图表问答(Chart-QA)任务的高质量数据集,专为 Adaption Labs AutoScientist Challenge(第二部分:数据可视化赛道)构建。数据集包含程序化生成的合成数据和人工编写的高难度数据两部分。
基本信息
- 总行数:1415 行(其中合成数据 1317 行,人工高难度数据 98 行)
- 图表类型:7 种,包括柱状图、折线图、分组柱状图、堆叠柱状图、饼图、环形图和混合图
- 任务类型:10 种,包括查找数值、绝对增量、最大/最小、排名顺序、类别比较、聚合求和/平均、多系列比较、趋势方向、百分比变化比率、硬性多步推理
- 难度分级:简单、中等、困难
- 语言:仅英语
- 领域:商业、金融、健康、政策
- 验证状态:所有行
verified=true - 许可证:CC-BY-4.0
数据构成
按来源
| 来源 | 行数 | 占比 |
|---|---|---|
| 合成数据 | 1317 | 93.1% |
| 人工高难度数据 | 98 | 6.9% |
按图表类型
| 图表类型 | 行数 |
|---|---|
| 柱状图 (bar) | 417 |
| 折线图 (line) | 288 |
| 分组柱状图 (grouped_bar) | 201 |
| 堆叠柱状图 (stacked_bar) | 184 |
| 饼图 (pie) | 155 |
| 混合图 (mixed) | 104 |
| 环形图 (donut) | 66 |
按任务类型
| 任务类型 | 行数 |
|---|---|
| 最大/最小 (max_min) | 301 |
| 查找数值 (lookup_value) | 273 |
| 绝对增量 (delta_absolute) | 156 |
| 排名顺序 (rank_order) | 141 |
| 类别比较 (compare_categories) | 131 |
| 趋势方向 (trend_direction) | 124 |
| 多系列比较 (multi_series_compare) | 111 |
| 聚合求和/平均 (aggregation_sum_avg) | 89 |
| 百分比变化比率 (percent_change_ratio) | 56 |
| 硬性多步推理 (hard_multi_step) | 33 |
按难度
| 难度 | 行数 |
|---|---|
| 中等 | 726 |
| 困难 | 358 |
| 简单 | 331 |
数据模式(Schema)
每行包含以下字段:
file_name:图表 PNG 的图像路径id:唯一行 ID(如syn_bar_0001__q1或hs_0007__q3)source:来源类型(synthetic或hardset)question:简短的问题文本answer:简短精确的答案(如数字、类别名称、百分比等)chart_type:图表类型(7 种枚举值之一)task_type:任务类型(10 种枚举值之一)difficulty:难度等级(easy、medium、hard)verified:验证状态(所有行均为true)split:数据划分(所有行均为train)notes:来源归属/生成器备注
验证协议
- 合成数据:通过可复现的种子随机生成图表,答案在图表绘制前根据底层数值直接计算得出,无需视觉估计,构造即正确。
- 人工高难度数据:每行由真实图表截图人工逐条编写,并逐行对照源图审查后才记录答案,所有问题均可仅凭图像回答。
人工数据来源
人工高难度数据来源于以下公开机构图表截图:
| 来源 | 行数 | 许可说明 |
|---|---|---|
| 加拿大统计局 (StatCan) | 24 | 开放许可协议 |
| 美国劳工统计局 (BLS) | 29 | 美国政府作品,公共领域 |
| 欧洲中央银行 (ECB) | 18 | 允许复制并注明出处 |
| 世界卫生组织 (WHO) | 21 | 参见归属说明 |
| 加拿大银行 (BoC) | 2 | 开放许可 |
| 气候政策数据库 | 4 | CC-BY-4.0 |
注意:WHO 源材料通常采用 CC-BY-NC-SA-3.0 IGO 许可,本数据集以视觉-语言模型训练的转化性目的使用 WHO 图表截图,并保留完整归属。对于商业用途有顾虑的用户,应筛选并单独处理 notes 字段以 hardset; WHO; 开头的行。
预期用途
- 微调多模态图表问答模型
- 短答案图表理解基准测试
- 图表类型或任务类型覆盖度的消融研究
不适合需要高精度 OCR 或从密集财务表格中精确提取数字的下游任务——本数据集专注于图表推理,而非精确数字提取。
已知局限性
- 仅英语
- 合成数据外观统一:所有合成行使用相同的 matplotlib 渲染器和一致风格,真实世界的视觉多样性完全来自人工高难度数据
- 人工高难度数据偏向
max_min和lookup_value:真实仪表盘天然支持这些任务,虽通过平衡步骤大幅削减合成数据中的max_min以补偿,但人工数据的结构性偏差仍然存在 chart_type=mixed仅出现在人工数据中:合成数据不生成多面板仪表盘,混合图对视觉语言模型而言视觉难度更高- 本文件无保留验证/测试集:外部评估切片(源自 ChartQAPro)有意置于数据集之外
引用
如需使用本数据集,请引用:
@misc{anbalagan2026adaptioncharts, title = {Adaption Charts P2: A Small Gold Chart-QA Dataset}, author = {Anbalagan, Vinod}, year = {2026}, howpublished = {url{https://huggingface.co/datasets/vinod-anbalagan/adaption-charts-p2-gold}} }
同时请根据实际情况注明"数据来源"部分所列上游图表来源。