
Draup – Technographics Data
收藏Snowflake2025-09-01 更新2025-09-09 收录
下载链接:
https://app.snowflake.com/marketplace/listing/GZT1Z2QTOT6
下载链接
链接失效反馈官方服务:
资源简介:
**Overview**
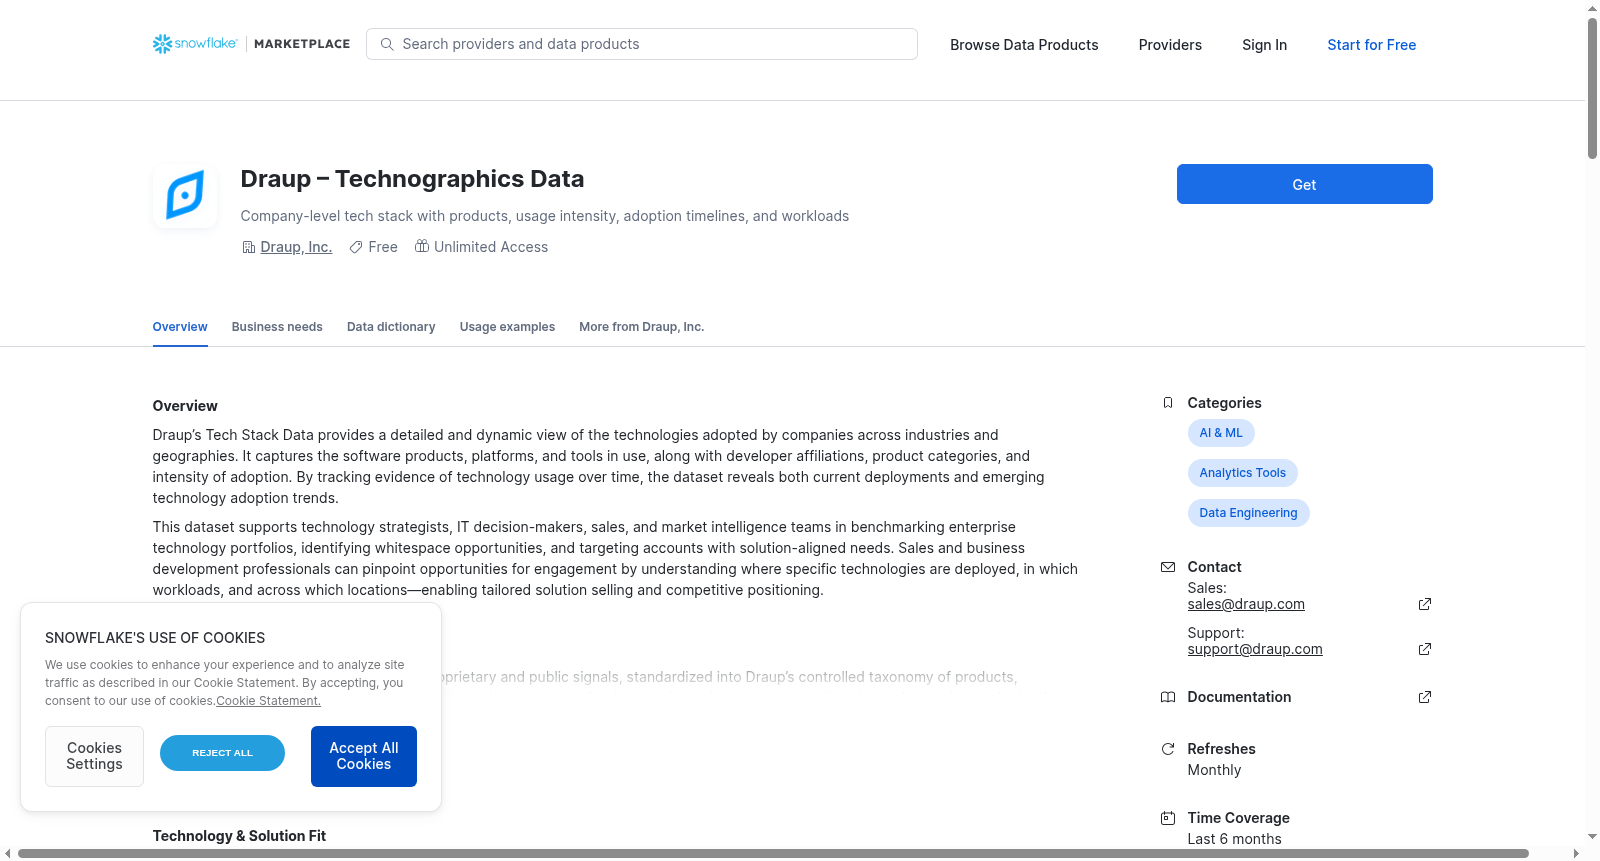
Draup’s Tech Stack Data provides a detailed and dynamic view of the technologies adopted by companies across industries and geographies. It captures the software products, platforms, and tools in use, along with developer affiliations, product categories, and intensity of adoption. By tracking evidence of technology usage over time, the dataset reveals both current deployments and emerging technology adoption trends.
This dataset supports technology strategists, IT decision-makers, sales, and market intelligence teams in benchmarking enterprise technology portfolios, identifying whitespace opportunities, and targeting accounts with solution-aligned needs. Sales and business development professionals can pinpoint opportunities for engagement by understanding where specific technologies are deployed, in which workloads, and across which locations—enabling tailored solution selling and competitive positioning.
<p><br/></p>
**Methodology & Quality**
Tech stack insights are aggregated from proprietary and public signals, standardized into Draup’s controlled taxonomy of products, categories, and workloads. Vendor-product hierarchies are normalized, usage intensity scores are assigned to reduce noise, and adoption timelines are tracked to capture both legacy and new technology footprints. Data is refreshed frequently to ensure recency and accuracy, with evidence tagging that provides transparency into the sources and confidence levels of adoption signals.
<p><br/></p>
**Key Tables Include**
- **Company–Technology Mapping**: company identifiers, company names, and adopted products.
- **Product Details**: product name, developer company, product sub-category, and product category.
- **Usage Intensity & Evidence**: confidence levels of adoption, new product flags, and first/recent evidence dates.
- **Workloads & Usage Context**: workloads where the product is applied and product usage locations.
- **Product Metadata**: product picture URLs, data creation, and update timestamps.
提供机构:
Draup, Inc.创建时间:
2025-08-26
原始信息汇总
Draup – Technographics Data 数据集概述
数据集基本信息
- 数据集名称:Draup – Technographics Data
- 提供商:Draup, Inc.
- 试用信息:提供30天免费试用
数据集描述
Draup的Tech Stack Data提供了跨行业和地域公司所采用技术的详细动态视图。该数据集捕获了正在使用的软件产品、平台和工具,以及开发者关联、产品类别和采用强度。通过随时间跟踪技术使用证据,数据集揭示了当前部署和新兴技术采用趋势。
主要用途
- 支持技术策略师、IT决策者、销售和市场情报团队进行企业技术组合基准测试
- 识别空白机会和针对具有解决方案对齐需求的账户
- 销售和业务开发专业人员通过了解特定技术的部署位置、工作负载和地点来精确定位参与机会
方法论与质量
技术堆栈洞察从专有和公共信号中聚合,标准化为Draup的受控产品、类别和工作负载分类法。供应商-产品层次结构被规范化,分配使用强度分数以减少噪音,并跟踪采用时间线以捕获传统和新技术足迹。数据经常刷新以确保及时性和准确性,证据标记提供采用信号来源和置信水平的透明度。
关键数据表
- Company–Technology Mapping:公司标识符、公司名称和采用的产品
- Product Details:产品名称、开发公司、产品子类别和产品类别
- Usage Intensity & Evidence:采用置信水平、新产品标志和首次/最近证据日期
- Workloads & Usage Context:产品应用的工作负载和产品使用位置
- Product Metadata:产品图片URL、数据创建和更新时间戳
数据字典示例(COMPANY_OVERVIEW表)
| 列名 | 数据类型 | 描述 |
|---|---|---|
| COMPANY_ID | Varchar | 公司ID |
| COMPANY_NAME | Varchar | 公司名称 |
| LOGO_URL | Varchar | 公司Logo URL |
| COMPANY_DESCRIPTION | Varchar | 公司描述 |
| HEADQUARTERS | Varchar | 总部所在地 |
| YEAR_ESTABLISHED | Number | 成立年份 |
| WEBSITE_AND_SOCIAL_URLS | Variant | 网站和社交媒体URL |
| COMPANY_TYPE | Varchar | 公司类型 |
| STOCK_EXCHANGE | Varchar | 证券交易所 |
| VERTICAL | Varchar | 行业垂直领域 |
| PRIMARY_VERTICAL | Varchar | 主要垂直领域 |
| SUB_VERTICAL | Varchar | 子垂直领域 |
| EMPLOYEE_COUNT | Number | 员工数量 |
| R_AND_D_WORKFORCE | Number | 研发人员数量 |
| DATE_CREATED | Timestamp_NTZ | 创建日期 |
| DATE_UPDATED | Timestamp_NTZ | 更新日期 |
使用案例
- 发现使用特定技术堆栈的账户(例如:在教育科技市场中使用Tableau或PowerBI的公司)
- 获取目标账户技术堆栈的全面映射(例如:Microsoft公司的技术产品采用情况)
- 识别使用竞争对手产品的零售公司(例如:在美国使用竞争技术的零售公司)
搜集汇总
数据集介绍
背景与挑战
背景概述
Draup – Technographics Data 提供了跨行业和地区的公司技术采用动态视图,涵盖软件产品、使用强度和工作负载等详细信息。该数据集支持技术战略和销售团队进行基准分析、机会识别和精准营销,数据通过标准化分类和频繁更新确保准确性和时效性。关键表包括公司技术映射、产品详情和使用证据等。
以上内容由遇见数据集搜集并总结生成


