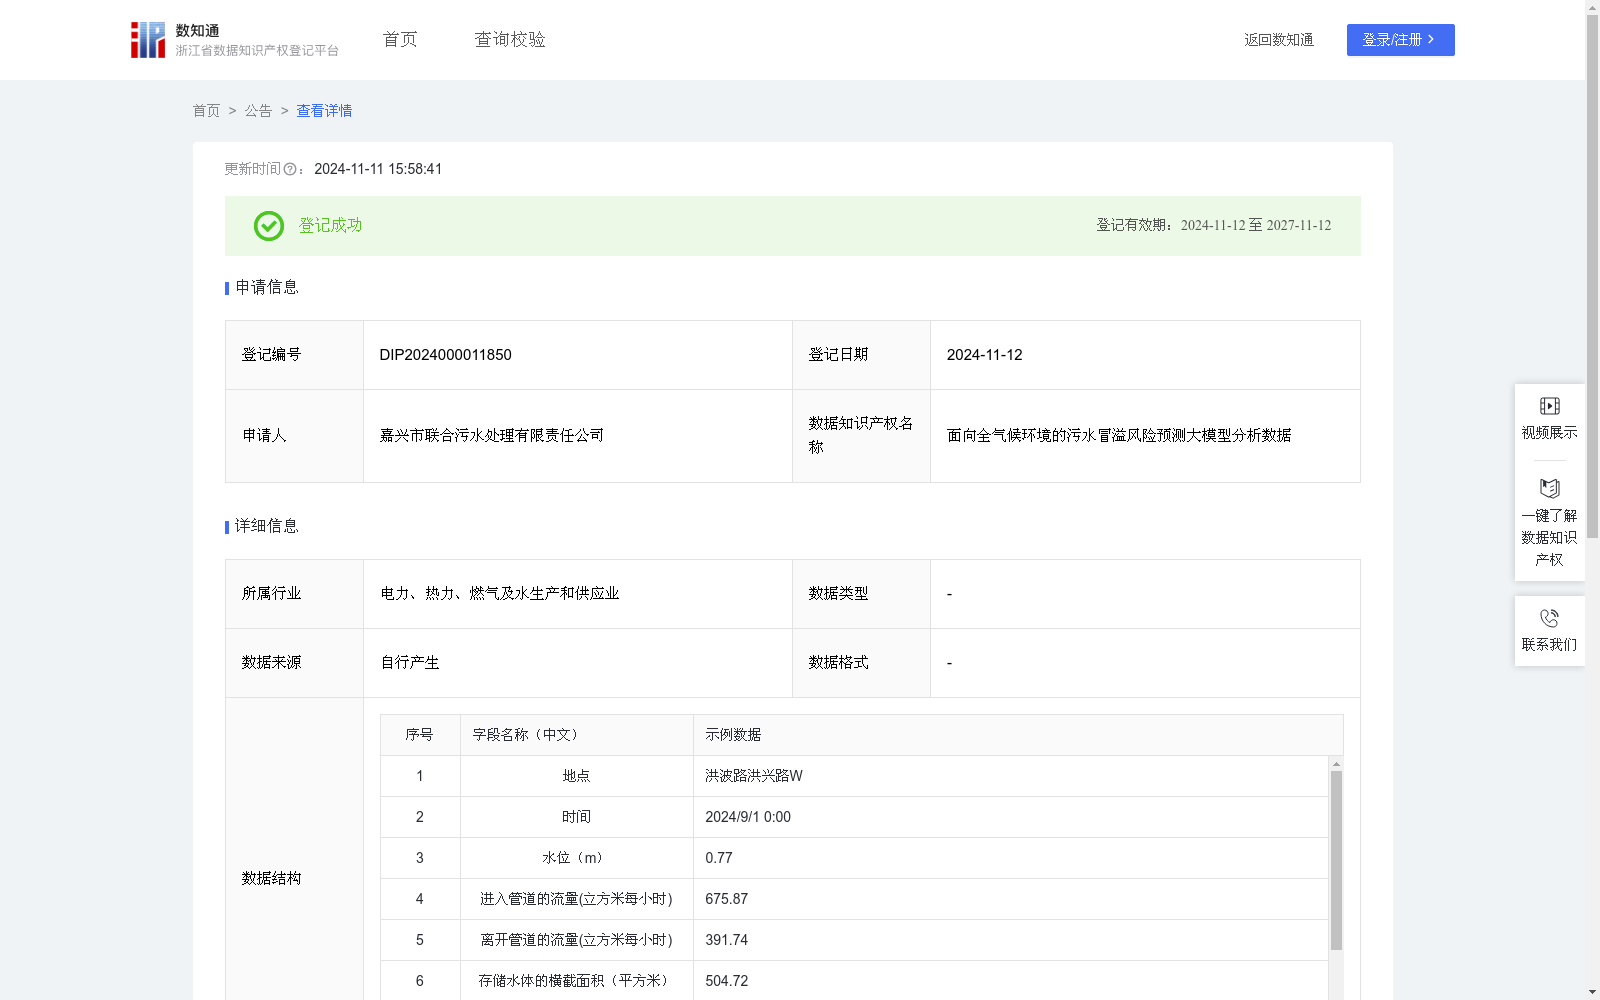
面向全气候环境的污水冒溢风险预测大模型分析数据
收藏浙江省数据知识产权登记平台2024-11-11 更新2024-11-12 收录
下载链接:
https://www.zjip.org.cn/home/announce/trends/83231
下载链接
链接失效反馈官方服务:
资源简介:
污水系统通常情况下不应出现冒溢问题,但由于城市进程加快,人口规模急剧增加,污水系统的设计标准难以满足日益增加的生活污水量。另一方面,城市中雨污分流制改造不彻底,导致暴雨等极端天气下,污水系统容易出现污水外溢现象。一旦出现污水冒溢现象,容易造成道路地面积水、行人出行不便、环境受到污染。以水力模型为基础,预测各类气候环境下可能发生的污水风险,为城市管理者争取足够的时间采取应对措施,避免污水冒溢事件的发生。算法原理:
构建污水系统的虚拟管网,将管网内的物理元素简化为模型元素,构建在线水力模型。同时将通过将液位、流量、降雨量导入水力模型进行分析运算,得出对应点位的污水冒溢风险。
数据采集:
1.模型元素为建设时一次性采集;2.液位、流量数据通过监测设备(液位计、流量计)实时采集,系统对各监测设备按地理位置进行编号,并通过物联网采集各个监测设备的监测数据,采集频率为1分钟/次;3.降雨量数据通过雨量计采集,采集频率为5分钟/次。
数据分析:
(1)水力模型采用一维非恒定流圣维南方程组、曼宁公式等方程对管道内的水流进行模拟,公式可部分简化为dH/dt=[(Qin-Qout)+R]/A *X,该方程能够输出水位变化趋势图。其中H是【水位】,t是【时间】,Qin是【进入管道的流量】,Qout是【离开管道的流量】,A是【存储水体的横截面积】,X为【模型系数】(模型元素经过一定量的计算后得出的系数)。R为【降雨量】(2)当【时间】变化时,根据水力模型模型绘制的【水位】变化趋势图会产生波动,【水位变化趋势】=dH/dt。当某个时间点的【水位变化趋势】大于30时,则可判定对应监测点可能存在污水冒溢风险。
Sewer systems should normally avoid overflow incidents. However, with accelerated urbanization and rapid population growth, the design standards of sewer systems can no longer meet the increasing volume of domestic sewage. On the other hand, the incomplete reform of the separate sewage and rainwater drainage system has led to frequent sewer overflow events in sewer systems during extreme weather such as heavy rain. Once sewer overflow occurs, it is likely to cause road surface water accumulation, inconvenience to pedestrians, and environmental pollution. Predicting potential sewage risks under various climatic conditions based on hydraulic models can provide city managers with sufficient time to take countermeasures and avoid sewer overflow incidents.
Algorithm Principle:
Construct a virtual pipe network of the sewer system, simplify the physical elements in the pipe network into model elements, and build an online hydraulic model. Meanwhile, import liquid level, flow rate and rainfall data into the hydraulic model for analysis and calculation, so as to obtain the sewer overflow risk at corresponding monitoring points.
Data Collection:
1. Model elements are collected once during the construction phase;
2. Liquid level and flow rate data are collected in real time by monitoring equipment (level gauges and flow meters). The system numbers each monitoring device according to its geographical location, and collects monitoring data from each device via the Internet of Things (IoT), with a collection frequency of once per minute;
3. Rainfall data is collected by rain gauges, with a collection frequency of once every 5 minutes.
Data Analysis:
(1) The hydraulic model uses equations such as the one-dimensional unsteady flow Saint-Venant equations and Manning's formula to simulate the flow in pipelines. The formula can be partially simplified as: dH/dt = [(Qin - Qout) + R]/A * X, which can output a water level change trend chart. Where H represents the water level, t represents time, Qin represents the flow rate entering the pipeline, Qout represents the flow rate leaving the pipeline, A represents the cross-sectional area of stored water, X represents the model coefficient (a coefficient calculated from model elements), and R represents the rainfall.
(2) As time changes, the water level change trend chart drawn based on the hydraulic model will fluctuate, and the water level change trend is equal to dH/dt. When the water level change trend at a certain time point exceeds 30, it can be determined that there is a potential sewer overflow risk at the corresponding monitoring point.
提供机构:
嘉兴市联合污水处理有限责任公司
创建时间:
2024-10-17
搜集汇总
数据集介绍
特点
该数据集是一个用于预测全气候环境下污水冒溢风险的大模型分析数据,包含546条记录,每日更新。数据涵盖水位、流量、降雨量等关键指标,通过水力模型分析预测风险,适用于城市污水管理场景。
以上内容由遇见数据集搜集并总结生成


