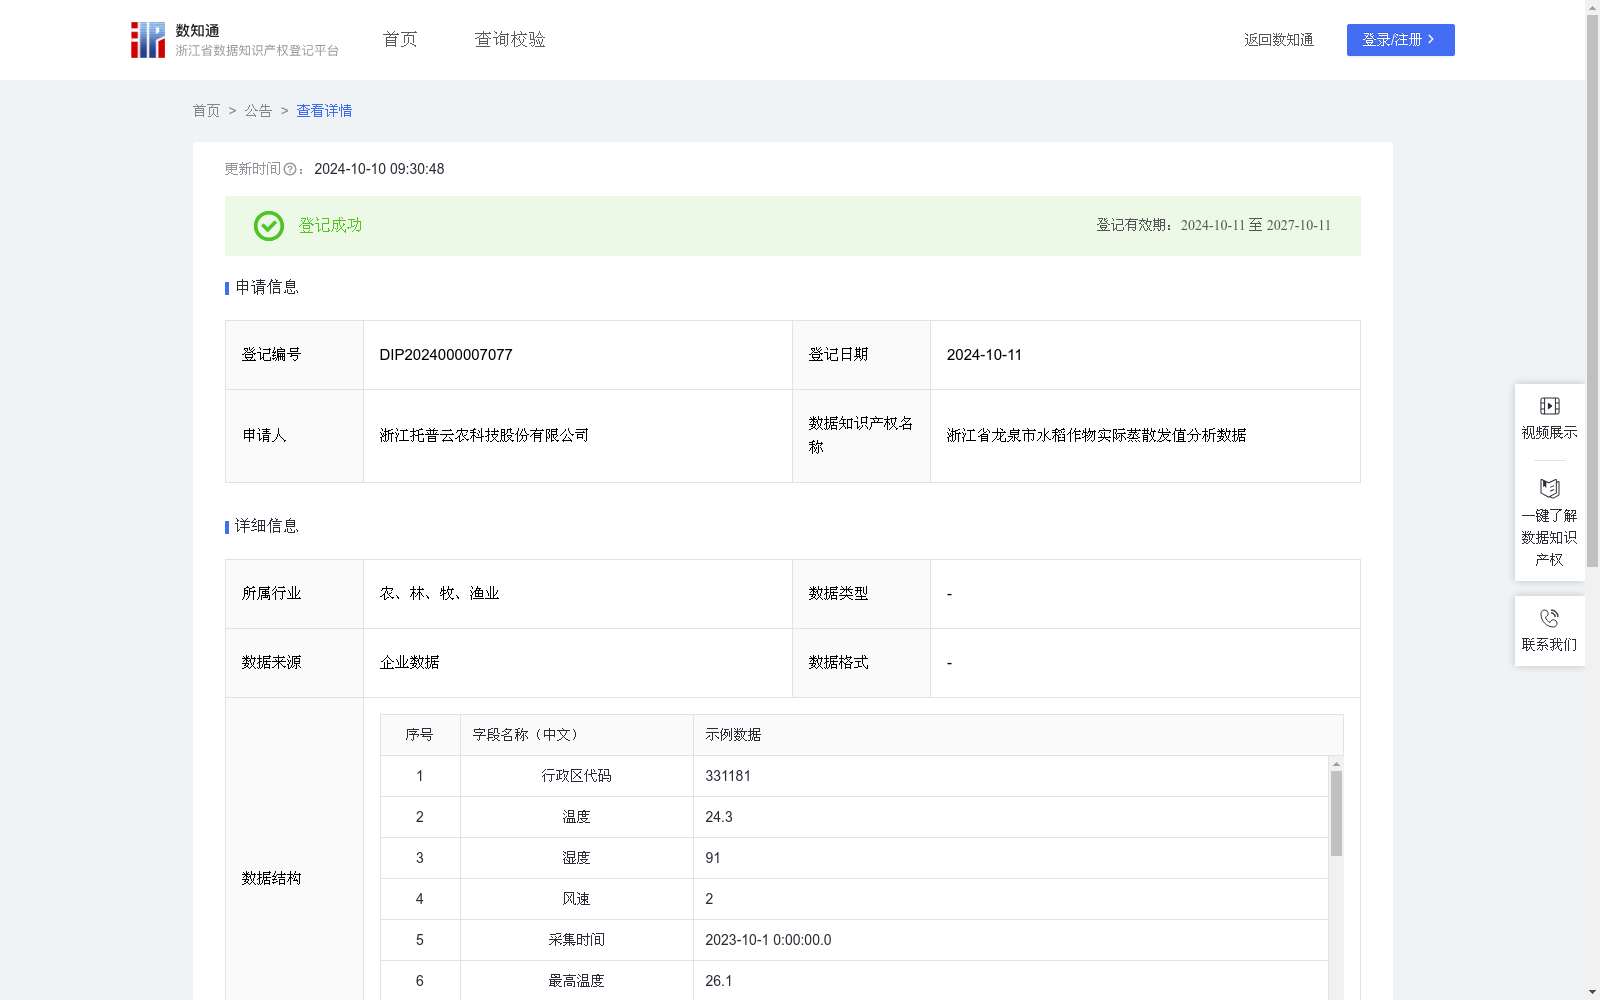
浙江省龙泉市水稻作物实际蒸散发值分析数据
收藏资源简介:
通过浙江托普云农智慧农业气象站设备采集数据,分析浙江省龙泉市水稻的作物实际蒸散发ETC值,通过对ETC数据分析得到水稻实际蒸发蒸腾情况,为灌溉和排水提供数据支撑,从而提高水稻的产量和质量。1、数据来源:通过浙江智慧农业气象站设备采集空气温度、湿度和风速数据,以一定采集周期上传即时数据。 2、数据处理:对采集到的数据进行去重、合并,按照区域分类、统计处理,计算出每日太阳净辐射量(W/m²)、平均温度(℃)、平均风速(m/s)、平均饱和蒸汽压(Pa)、环境湿度(%rh)、大气压值斜率、空气湿度常数,结合水稻作物系数KC值,计算作物实际蒸散发值ETC: ETC=(0.408*(每日太阳净辐射量-土壤热通量)*大气压值斜率/(大气压值斜率+(空气湿度常数*(1+0.34*平均风速)))+900*平均风速/(平均温度+273.15)*(平均饱和蒸汽压-环境湿度)*空气湿度常数/(大气压值斜率+(空气湿度常数*(1+0.34*平均风速))))*KC,这里的土壤热通量的值为0。 3、数据应用:通过长期ETC数据跟踪与分析,实现对该区域水稻的蒸发蒸腾定量监测,为灌溉和排水提供数据支撑,从而提高水稻的产量和质量。
This dataset is constructed using data collected via Zhejiang Top Cloud-agri Smart Agricultural Meteorological Station equipment, for the analysis of actual crop evapotranspiration (ETC) values of rice in Longquan City, Zhejiang Province. The actual evapotranspiration conditions of local rice are derived from ETC data analysis, which provides data support for irrigation and drainage, thereby improving rice yield and quality. 1. Data Source: Air temperature, relative humidity and wind speed data are collected by the aforementioned smart agricultural meteorological station equipment, with real-time data uploaded at a fixed sampling interval. 2. Data Processing: The collected data is processed through deduplication, merging, regional classification and statistical analysis. Subsequently, daily solar net radiation (W/m²), average temperature (℃), average wind speed (m/s), average saturated vapor pressure (Pa), relative humidity (%rh), atmospheric pressure slope and air humidity constant are calculated. Combined with the rice crop coefficient (KC value), the actual crop evapotranspiration value (ETC) is calculated using the following formula: ETC = [0.408 * ((Daily Solar Net Radiation - Soil Heat Flux) * Atmospheric Pressure Slope / (Atmospheric Pressure Slope + Air Humidity Constant * (1 + 0.34 * Average Wind Speed))) + 900 * (Average Wind Speed / (Average Temperature + 273.15)) * (Average Saturated Vapor Pressure - Relative Humidity) * Air Humidity Constant / (Atmospheric Pressure Slope + Air Humidity Constant * (1 + 0.34 * Average Wind Speed))] * KC Note: The soil heat flux value is set to 0 in this calculation. 3. Data Application: Through long-term tracking and analysis of ETC data, quantitative monitoring of rice evapotranspiration in this region is achieved, providing data support for irrigation and drainage, thereby improving rice yield and quality.