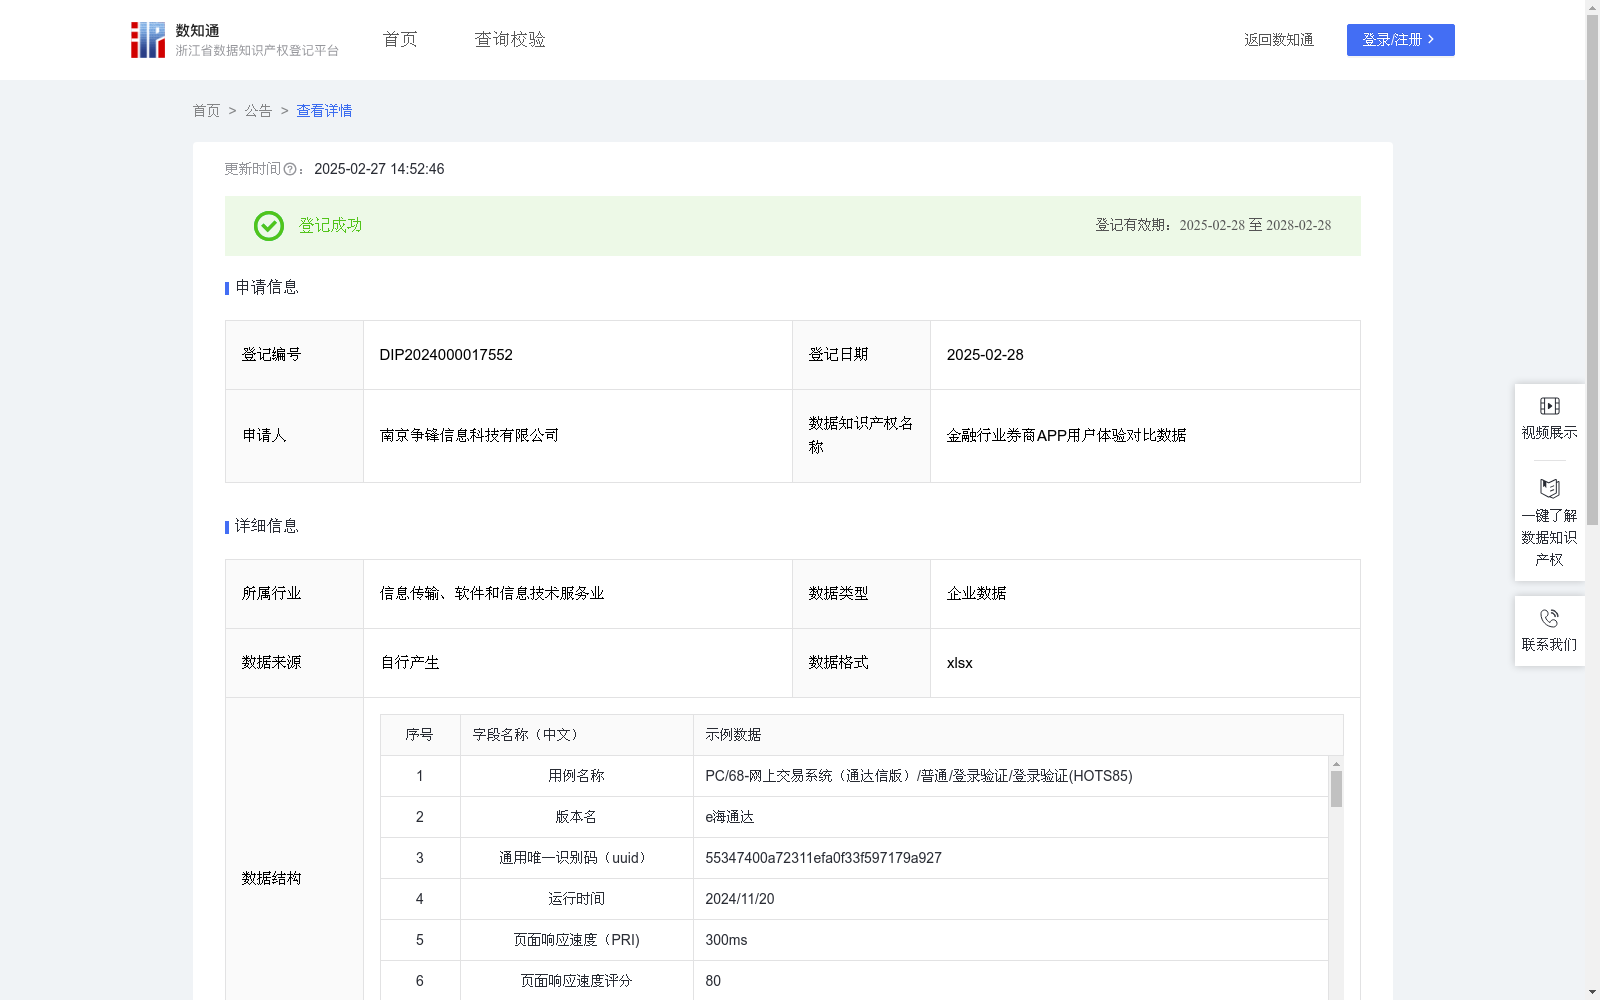
金融行业券商APP用户体验对比数据
收藏浙江省数据知识产权登记平台2025-02-27 更新2025-02-28 收录
下载链接:
https://www.zjip.org.cn/home/announce/trends/114694
下载链接
链接失效反馈官方服务:
资源简介:
用于同行业竞品对比分析,通过真实用户体验测试和产品性能竞品测试服务,从用户使用产品过程中的评价和体验等方面对比各家排名靠前券商APP。通过UI自动化手段,依托智能图像识别等技术,实现对手机APP的控制和模拟人工的操作;从真实的用户视角出发,对行情、交易、资讯、账户等核心业务进行连续不断的全链路感知探测,实现业务用例(如买、卖、撤、查,以及各种高权限操作等)、场景和终端设备(Android应用、iOS应用、鸿蒙应用等)全覆盖。同时提供各类真实生产账户和专用真机设备,用自动化设备对各券商客户端的界面及其子菜单进行周期性模拟操作,实现用户操作行为+真实证券交易账户+7x24小时专用真机探测的方式对APP全功能测试,获取一手的感知数据及评分,用作各类客户端业务机型自动化真机探测。帮助企业了解市场趋势,了解竞争对手的情况;不断修改已有缺陷的同时结合市场趋势增加新功能,提高企业的竞争能力。根据PTECH模型进行产品对比,分别从性能体验、任务体验、参与度、清晰度和满意度五个维度对券商app进行分析:
(1)性能体验:产品性能表现,如页面打开、app端发起请求的成功率、系统稳定性、crash率等。
性能体验评分 = (w1 * 页面响应速度评分) + (w2 * app端发起请求成功率评分) + (w3 * crash率评分)
(2)任务体验:产品核心任务流程中的流畅度问题、功能适用性、准确性等。
任务体验评分 = (w1 * 流程顺畅度评分) + (w2 * 功能适用性评分) +(w3 * 功能准确性评分)+(w4*页面加载满意度)
(3)参与度:产品提供的功能是都可以满足工作需求、用户评分、留存率。
参与度评分 = (w1 * 功能覆盖率评分) + (w2 * 用户活跃度评分) + (w3 * 新用户7日留存率评分)
(4)清晰度:功能设计、引导、帮助系统清晰度,用户能够自主完成各项工作。
清晰度评分 = (w1 * 功能设计清晰度评分) + (w2 * 引导与帮助系统清晰度评分)
(5)满意度:用户对产品不同方面的主观满意度,比如视觉美观,客服支持等。
满意度评分 = (w1 * 页面美化度评分) + (w2 *客服支持满意度评分) + (w3 * 整体满意度评分)
综合评分 = 【(w1 * 性能体验评分) + (w2 * 任务体验评分) + (w3 * 参与度评分) + (w4 * 清晰度评分) + (w5 * 满意度评分)】/5
权重:每个 ( w ) 代表各指标的权重。权重可以根据具体需求进行调整,所有权重的总和应为1。
This dataset is designed for cross-competitor analysis within the same industry. It conducts real user experience tests and product performance competitor tests to compare top-ranked securities trading apps from the perspectives of user reviews and in-use experiences. Leveraging UI automation approaches and technologies such as intelligent image recognition, it enables control over mobile apps and simulation of manual operations. Starting from a real user's perspective, it performs continuous end-to-end perception detection on core businesses including market quotes, trading, information, and account management, achieving full coverage of business use cases (such as buying, selling, order cancellation, querying, and various high-privilege operations), usage scenarios, and terminal devices (Android apps, iOS apps, HarmonyOS apps, etc.).
The dataset also provides a variety of real production accounts and dedicated physical devices. It uses automated equipment to conduct periodic simulated operations on the interfaces and submenus of each securities trading client, realizing full-function testing of apps through the combination of user operation behaviors, real securities trading accounts, and 24/7 dedicated physical device detection. It collects first-hand perception data and scoring results, which are used for automated physical device detection across various client businesses and device models.
This dataset helps enterprises gain insights into market trends and competitor landscapes, revise existing defects, add new functions in line with market trends, and enhance their competitive strength. Product comparison is conducted via the PTECH model, with securities trading apps analyzed across five dimensions: performance experience, task experience, engagement, clarity, and satisfaction.
1. Performance Experience: Refers to the product's performance metrics, such as page opening speed, success rate of requests initiated by the app, system stability, crash rate, etc.
Performance Experience Score = (w₁ × Page Response Speed Score) + (w₂ × App-side Request Success Rate Score) + (w₃ × Crash Rate Score)
2. Task Experience: Refers to the smoothness of core task workflows, functional applicability, accuracy, and other related aspects of the product.
Task Experience Score = (w₁ × Process Smoothness Score) + (w₂ × Functional Applicability Score) + (w₃ × Functional Accuracy Score) + (w₄ × Page Loading Satisfaction Score)
3. Engagement: Refers to whether the functions provided by the product can meet work requirements, user ratings, and retention rates.
Engagement Score = (w₁ × Function Coverage Score) + (w₂ × User Activity Score) + (w₃ × New User 7-day Retention Rate Score)
4. Clarity: Refers to the clarity of function design, guidance, and help systems, enabling users to complete various tasks independently.
Clarity Score = (w₁ × Function Design Clarity Score) + (w₂ × Guidance and Help System Clarity Score)
5. Satisfaction: Refers to users' subjective satisfaction with different aspects of the product, such as visual aesthetics, customer service support, and so on.
Satisfaction Score = (w₁ × Page Aesthetics Score) + (w₂ × Customer Service Support Satisfaction Score) + (w₃ × Overall Satisfaction Score)
Comprehensive Score = [(w₁ × Performance Experience Score) + (w₂ × Task Experience Score) + (w₃ × Engagement Score) + (w₄ × Clarity Score) + (w₅ × Satisfaction Score)] / 5
Weights: Each (w) represents the weight of the corresponding indicator. Weights can be adjusted based on specific requirements, and the sum of all weights must equal 1.
提供机构:
南京争锋信息科技有限公司
创建时间:
2024-11-29
搜集汇总
数据集介绍
以上内容由遇见数据集搜集并总结生成


