
Temperature Readings : IOT Devices
收藏www.kaggle.com2019-12-01 更新2025-03-25 收录
下载链接:
https://www.kaggle.com/atulanandjha/temperature-readings-iot-devices
下载链接
链接失效反馈官方服务:
资源简介:
### Context
`IIoT 4.0` is coming to cover all enterprise monitoring and maintenance system. Thus, we need bold and sustainable algorithms and approaches to *analyze the IOT sensor data* and find hidden patterns and insights. **Heat Index** ( *temperature + humidity* ) is one common data recorded on these IOT readers. The frequency of the upcoming data is very fast. The sensor reads *hundreds to millions of data per second*. There is a huge and versatile application of this data in real world. like:- Agriculture, weather forecasting, soil monitoring and treatment, enterprise maintenance, Data centres, and many more...
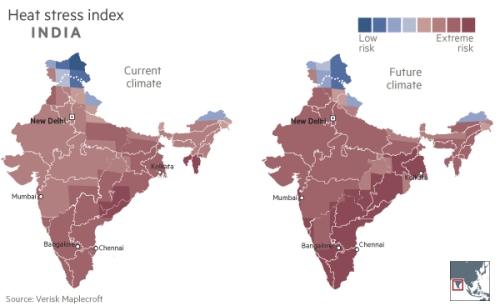
Therefore, Wrangling, analyzing, and grasping insights from these data are equally important for multiple application sectors. This dataset is a small snap ( **sample**) out of ocean-depth entries in the original dataset, which keeps increasing day by day. The purpose of this dataset is to allow fellow Scientists/ Analysts to play and ***Find the unfounds***. 🙏
### Content
This dataset contains the temperature readings from IOT devices installed outside and inside of an anonymous Room (say - admin room). The device was in the alpha testing phase. So, It was uninstalled or shut off several times during the entire reading period ( **28-07-2018 to 08-12-2018**). This random interval recordings and few mis-readings ( outliers) makes it more challanging to perform analysis on this data. Let's see, what you can present in the plate out of this messy data.
# ------------------------------------------------
***##### Technical Details:***
**columns = 5 | Rows = 97605**
`id` : unique IDs for each reading
`room_id/id` : room id in which device was installed (inside and/or outside) -> currently 'admin room' only for example purpose.
`noted_date` : date and time of reading
`temp` : temperature readings
`out/in` : whether reading was taken from device installed inside or outside of room?
### Acknowledgements
I sincerely thank the team wokring at `**LimelightIT Research**` for providing me the device to record the data and helping me throughout the project.
### Inspiration
I have always been curious to know how climate changes day by day, year to year. One way to understnad this is by analysis and understanding the heat index of an area. Temperature data is a small part of it. But, The finidngs can lead to bigger and more serious inventions and outcomes!
***From this dataset , it would be intersting to find out:***
- what was the max and min temperature?
- How outside temperature was related to inside temperature? any relation between the two?
- What was the variance of temperature for inside and outside room temperature?
- What is the trend in the data?
- Can you use Time Series Forecast algo to predict the next scenario?
- which was the hottest/coolest month ?
- any warning signals fro climate disaster ?
- and many more...
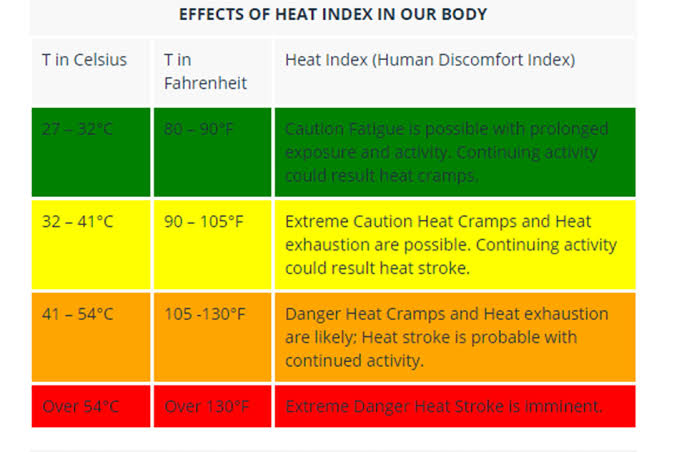
**Data Science is all about finding the possibilities and verifying the probabilities!**
### Thanks !
### 概述
`IIoT 4.0` 正在向涵盖所有企业监控与维护系统迈进。因此,我们迫切需要强劲且可持续的算法与方法,以分析物联网传感器数据,探寻隐藏的模式与洞见。**热指数**(*温度 + 湿度*)是这些物联网读取器上记录的常见数据之一。数据更新的频率极快,传感器每秒读取数百到数百万条数据。这些数据在现实世界中的应用领域极为广泛,例如:农业、天气预报、土壤监测与处理、企业维护、数据中心等。

因此,对数据进行整理、分析以及从中提炼洞见,对于多个应用领域同等重要。本数据集仅为原始数据集中海量条目中抽取的一小部分样本,而原始数据集的规模正日益扩大。本数据集的目的是为了允许同行科学家/分析师们进行探索,并**发现未知之处**。🙏
### 内容
本数据集包含安装在匿名房间(例如 - 管理室)内外物联网设备上的温度读数。该设备处于alpha测试阶段,因此在整个读取期间(**2018年7月28日至2018年12月8日**)被多次卸载或关闭。这种随机的记录间隔和少量误读(异常值)使得对数据进行分析更具挑战性。让我们看看,您能从这些混乱的数据中呈现哪些内容。
# ------------------------------------------------
***##### 技术细节:***
**列数 = 5 | 行数 = 97605**
`id`:每次读取的唯一标识符
`room_id/id`:设备安装的房间标识符(目前仅用于示例目的,为“管理室”)。
`noted_date`:读取的日期和时间
`temp`:温度读数
`out/in`:读取是否来自安装在房间内或房间外的设备?
### 致谢
我衷心感谢 `**LimelightIT Research**` 团队为我提供记录数据的设备,并在整个项目中给予的帮助。
### 灵感
我一直对每日、每年气候变化的细微差别感到好奇。了解区域热指数变化的一种方式是通过分析和理解区域热指数。温度数据只是其中一小部分。然而,这些发现可能导致更大、更严肃的发明和成果!
从本数据集中,可以探讨以下问题:
- 最大和最小温度是多少?
- 外部温度与内部温度之间有何关联?是否存在两者之间的关联?
- 内外房间温度的温度变化范围是多少?
- 数据中的趋势是什么?
- 是否可以使用时间序列预测算法来预测下一个场景?
- 哪个月是最热/最冷的?
- 是否有任何气候灾难的预警信号?
等等...
**数据科学的核心在于发现可能性并验证概率!**
### 感谢!
提供机构:
www.kaggle.com
搜集汇总
数据集介绍
背景与挑战
背景概述
该数据集记录了2018年期间物联网设备在'admin room'室内外采集的温度数据,包含97,605条不规则间隔的读数,适用于时间序列分析和气候模式研究。数据包含异常值和设备测试阶段的间歇性记录,为分析提供了挑战性。
以上内容由遇见数据集搜集并总结生成



