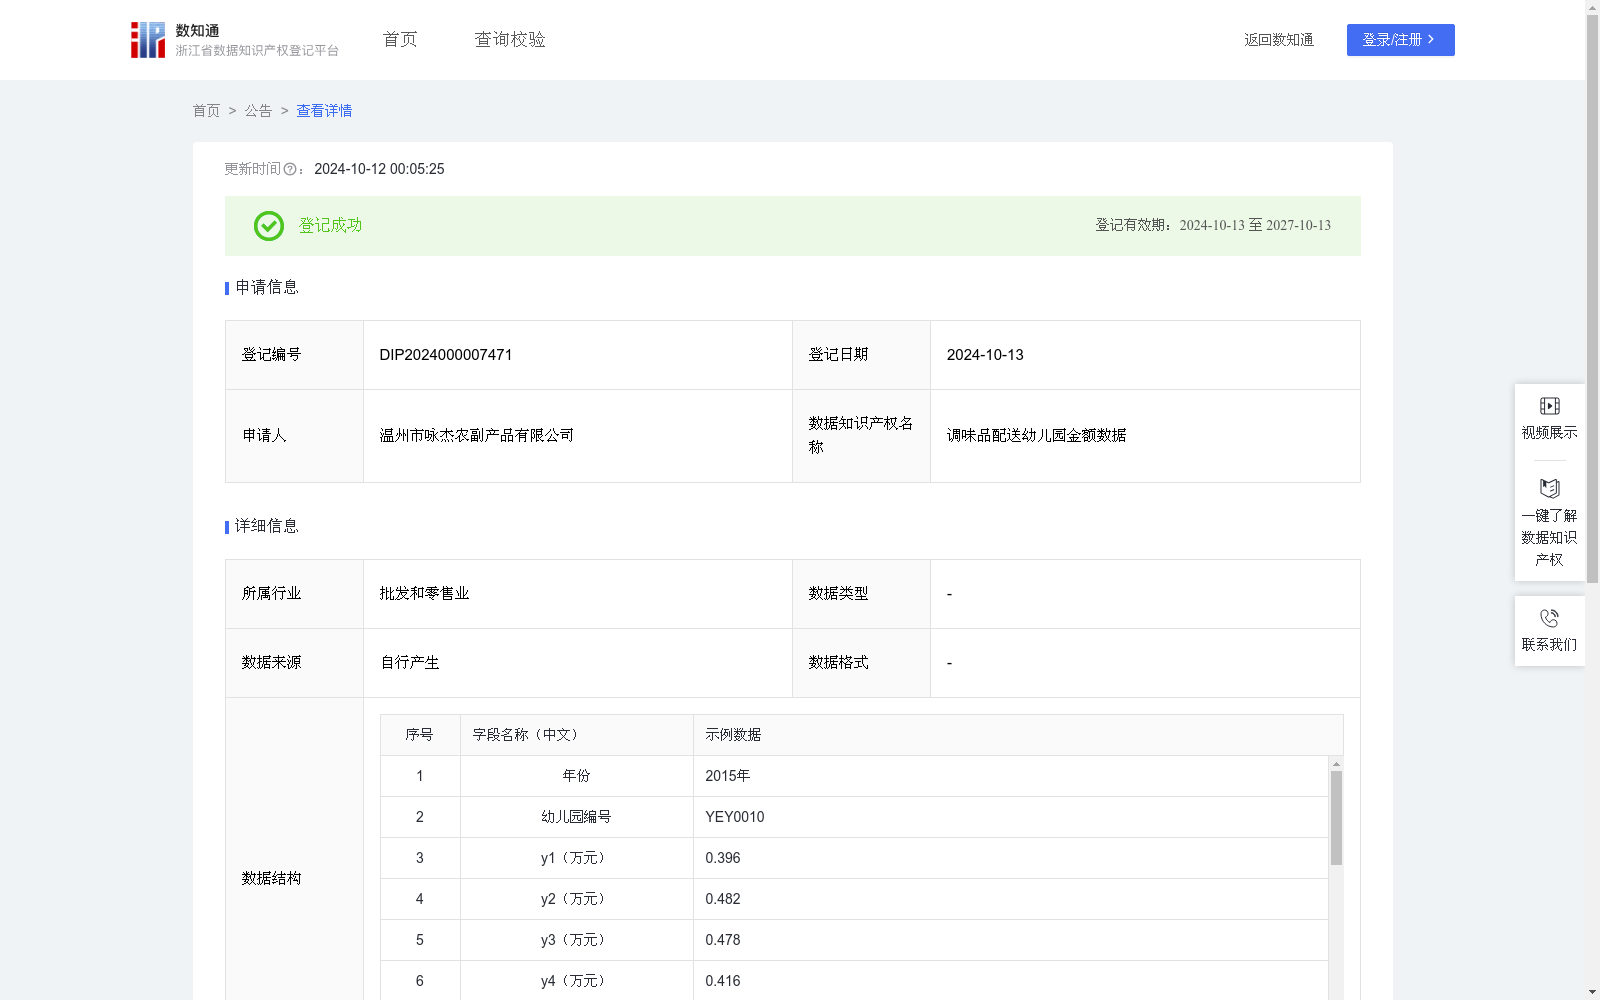
调味品配送幼儿园金额数据
收藏资源简介:
通过配送管理系统软件采集本公司调味品配送幼儿园订单信息,将不同的配送订单以各幼儿园来划分,从而计算各个幼儿园每个月的配送金额数据,再计算出每年配送金额的方差大小,方差大小用来评价各个幼儿园的配送情况,从而用于评估所有幼儿园的采购和配送策略,所有配送企业可以通过该数据了解调味品在不同幼儿园的配送行情,以平衡采购和配送调味品数量。对于超平稳型幼儿园,所有配送企业无需时时关注该幼儿园的行情,可每月保持好调味品的采购和配送数量;对于一般平稳型幼儿园,所有配送企业需每季度关注该幼儿园的行情,适当调整调味品的采购和配送数量;而对于波动型幼儿园,所有配送企业需每月时时关注该幼儿园行情,了解该幼儿园的配送行情变化,以适应大幅度调整调味品的采购和配送数量变化。步骤1:通过配送管理系统软件采集本公司调味品配送幼儿园的订单信息,将不同的配送订单以各幼儿园来划分归类,从而将各年度每个月配送至幼儿园的金额,从一月至十二月依次用y1,y2...y12表示,并汇总计算得到各个幼儿园当年的总配送金额y。步骤2:计算各幼儿园的月平均配送金额y̅=各个幼儿园当年的总配送金额y/12。步骤3:根据方差公式计算方差s2={(y1-y̅)^2+(y2-y̅)^2+(y3-y̅)^2+…+(y12-y̅)^2}/12,从而得到各个幼儿园的配送金额的方差s2大小。步骤4:当方差s2小于0.004评价该幼儿园为超平稳型幼儿园。当方差s2大于等于0.004并且小于等于0.012评价该幼儿园为一般平稳型幼儿园。当方差s2大于0.012评价该幼儿园为波动型幼儿园。
This dataset is developed by collecting order data of the company's condiment deliveries to kindergartens through the dedicated delivery management system software. First, all delivery orders are grouped by the receiving kindergarten to calculate the monthly delivery amount for each institution. Next, the annual variance of the total annual delivery amount is computed, where the variance value serves as an indicator to evaluate the delivery performance of each kindergarten, supporting the assessment of procurement and delivery strategies across all partner kindergartens. All delivery service providers can utilize this dataset to gain insights into the condiment delivery market dynamics across different kindergartens, thereby balancing the quantity of condiments procured and delivered. Three categories of kindergartens are defined based on the variance results: 1. Ultra-stable kindergartens: All delivery enterprises do not need to closely monitor their market conditions, and can maintain consistent condiment procurement and delivery volumes on a monthly basis. 2. Generally stable kindergartens: All delivery enterprises need to review their market conditions quarterly and make appropriate adjustments to the condiment procurement and delivery volumes. 3. Volatile kindergartens: All delivery enterprises need to closely monitor their market conditions monthly to track changes in delivery dynamics, so as to make significant adjustments to condiment procurement and delivery volumes in a timely manner. The specific calculation and classification steps are as follows: Step 1: Collect the order information of the company's condiment deliveries to kindergartens via the delivery management system software, and categorize different delivery orders by individual kindergartens. The monthly delivery amounts to each kindergarten in a given calendar year are denoted as y₁, y₂, ..., y₁₂ in the order from January to December, and the total annual delivery amount y for each kindergarten is obtained through summation. Step 2: Calculate the monthly average delivery amount of each kindergarten as ȳ = y / 12, where y refers to the total annual delivery amount of the kindergarten. Step 3: Compute the variance s² using the standard variance formula for 12 monthly data points: s² = [(y₁ - ȳ)² + (y₂ - ȳ)² + (y₃ - ȳ)² + … + (y₁₂ - ȳ)²] / 12 This yields the variance s² of the monthly delivery amounts for each kindergarten. Step 4: Perform classification based on the variance value: - A kindergarten is classified as ultra-stable if s² < 0.004; - A kindergarten is classified as generally stable if 0.004 ≤ s² ≤ 0.012; - A kindergarten is classified as volatile if s² > 0.012.