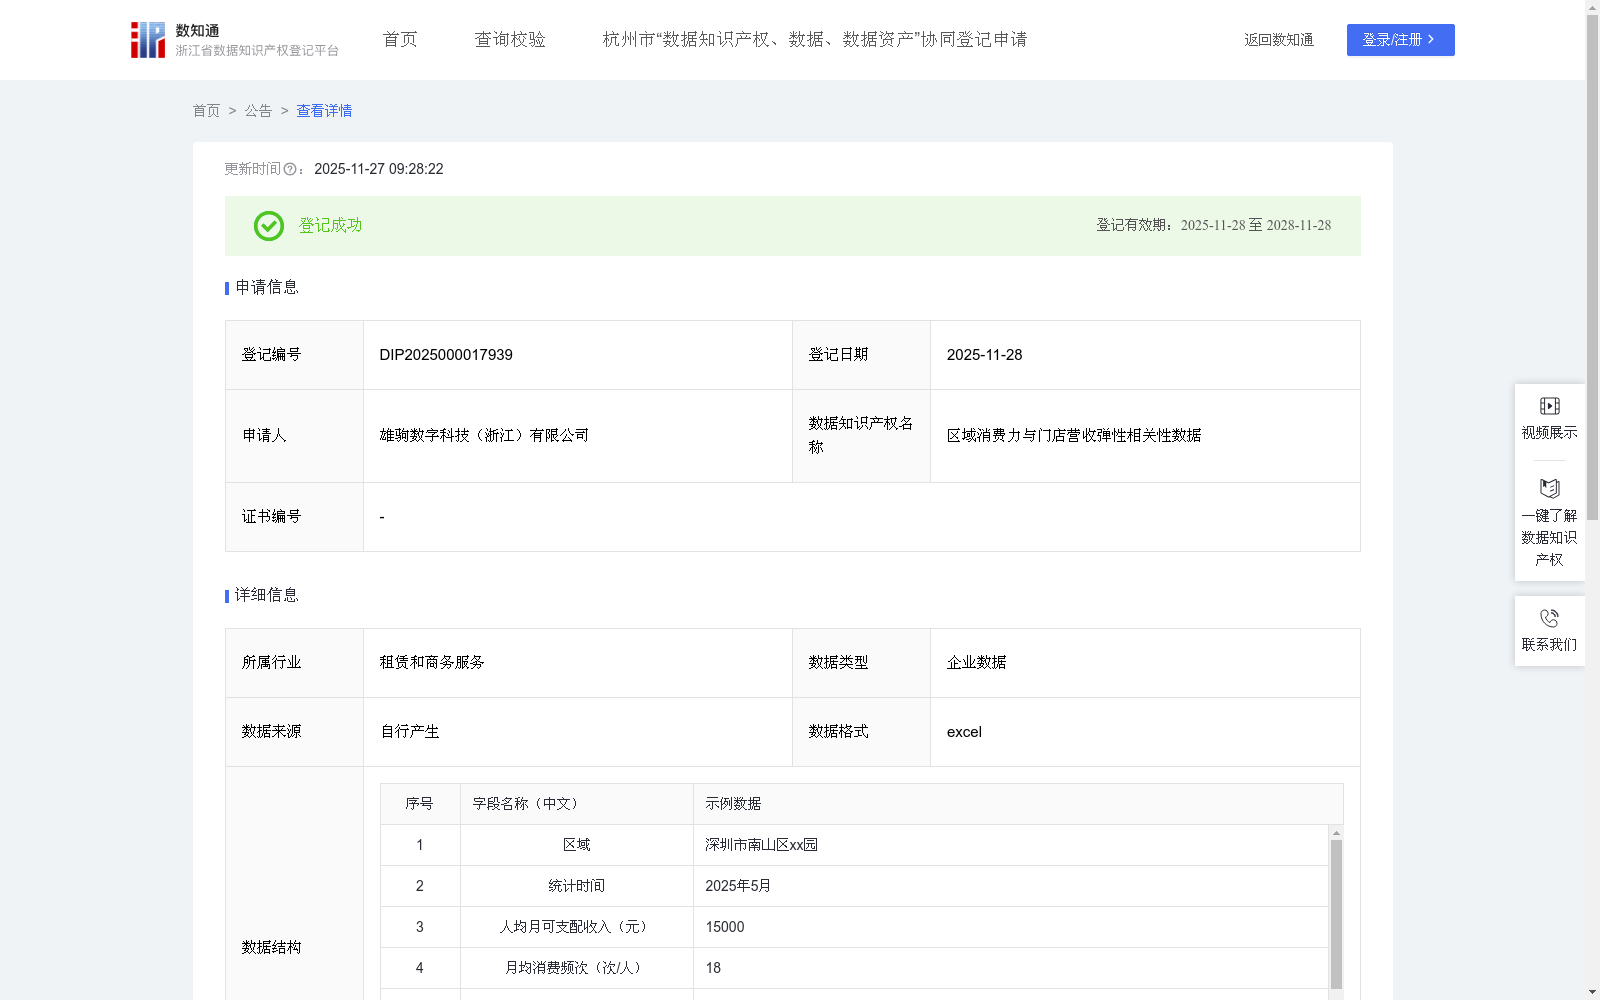
区域消费力与门店营收弹性相关性数据
收藏浙江省数据知识产权登记平台2025-11-27 更新2025-11-28 收录
下载链接:
https://www.zjip.org.cn/home/announce/trends/8406679
下载链接
链接失效反馈官方服务:
资源简介:
适用于各类实体门店(如零售、餐饮、服饰等)分析区域消费力与营收弹性的相关性,为经营决策提供数据支持。适用范围涵盖全国各城市商业区域,服务对象包括连锁企业、个体商户、商业地产运营机构、市场调研公司等。通过挖掘区域消费力指标(如人均消费能力、消费偏好等)与门店营收弹性的关联规律,帮助商家判断目标区域的经营适配性,例如辅助零售企业评估某区域消费力能否支撑门店营收稳定增长,或预测区域消费变化对门店营收的影响程度,从而优化拓店策略、调整库存及定价方案。1.数据采集:数据来源企业自有系统;
2.数据处理:对采集数据进行清洗,去除重复记录、异常值(如明显错误的营收数据)及无效信息(如未标注区域的消费记录);对区域名称进行标准化处理(统一行政区划名称格式);对数值型指标(如人均收入)进行归一化处理,统一量纲;采用哈希算法对门店ID进行匿名化处理,保护商业隐私。
3.算法加工:结合行业经验和历史数据相关性分析,为消费力指标赋予权重(人均月可支配收入0.3、月均消费频次0.2、平均客单价0.3、消费品类偏好匹配度0.2)。其中平均客单价取值方式为门店在一个月内,总营业额除以该月内的交易总次数;相关系数采用皮尔逊相关系数,取值范围在 -1 到 1 之间;消费品类偏好匹配度,其衡量方式为按 该区域消费品类偏好”与 门店类型的匹配程度,赋予 0-1的量化分值取值:0 表示完全不匹配,1表示完美匹配;关联指数计算公式为:关联指数=(人均月可支配收入×0.3+月均消费频次×0.2+平均客单价×0.3+消费品类偏好匹配度×0.2×相关系数)/100。
4.数据分类分级:根据关联指数划分关联等级:强关联:关联指数≥50;中等关联:30≤关联指数<50;弱关联:关联指数<30
This dataset is designed for analyzing the correlation between regional consumption capacity and revenue elasticity across various physical stores (e.g., retail, catering, apparel, etc.), providing data support for business decision-making. Its scope covers commercial areas in all cities across the country, and its target users include chain enterprises, individual businesses, commercial real estate operators, market research firms, etc. By mining the correlation rules between regional consumption capacity indicators (e.g., per capita consumption capacity, consumption preferences, etc.) and store revenue elasticity, it helps merchants judge the business adaptability of target areas. For example, it assists retail enterprises in evaluating whether the regional consumption capacity can support stable growth of store revenue, or predict the impact of regional consumption changes on store revenue, so as to optimize store expansion strategies, adjust inventory and pricing plans.
1. Data Collection: Data is sourced from the enterprise's own internal systems;
2. Data Processing: Clean the collected data by removing duplicate records, outliers (e.g., obviously erroneous revenue data) and invalid information (e.g., consumption records without marked regions); standardize regional names (unify the format of administrative division names); normalize numerical indicators (e.g., per capita income) to unify their dimensions; anonymize store IDs using hash algorithms to protect commercial privacy.
3. Algorithm Processing: Combine industry experience and historical data correlation analysis to assign weights to consumption capacity indicators (per capita monthly disposable income: 0.3, monthly average consumption frequency: 0.2, average customer unit price: 0.3, consumption category preference matching degree: 0.2). The average customer unit price is calculated as the total store revenue in one month divided by the total number of transactions in that month; the correlation coefficient uses the Pearson correlation coefficient, with a value range of -1 to 1; the consumption category preference matching degree is a quantitative score from 0 to 1, assigned based on the matching degree between the regional consumption category preferences and the store type, where 0 indicates completely unmatched and 1 indicates perfectly matched; the correlation index is calculated as: Correlation Index = (per capita monthly disposable income × 0.3 + monthly average consumption frequency × 0.2 + average customer unit price × 0.3 + consumption category preference matching degree × 0.2 × correlation coefficient) / 100.
4. Data Classification and Grading: Divide correlation levels based on the correlation index: Strong correlation: Correlation Index ≥ 50; Medium correlation: 30 ≤ Correlation Index < 50; Weak correlation: Correlation Index < 30
提供机构:
雄驹数字科技(浙江)有限公司
创建时间:
2025-08-26
搜集汇总
数据集介绍
背景与挑战
背景概述
该数据集聚焦于分析区域消费力与门店营收弹性的相关性,包含800条记录,涵盖人均收入、消费频次等关键指标,通过加权算法计算关联指数和等级。适用于实体门店评估区域经营适配性,辅助优化拓店和库存策略,数据来源于企业自有系统并经过清洗和匿名化处理。
以上内容由遇见数据集搜集并总结生成


