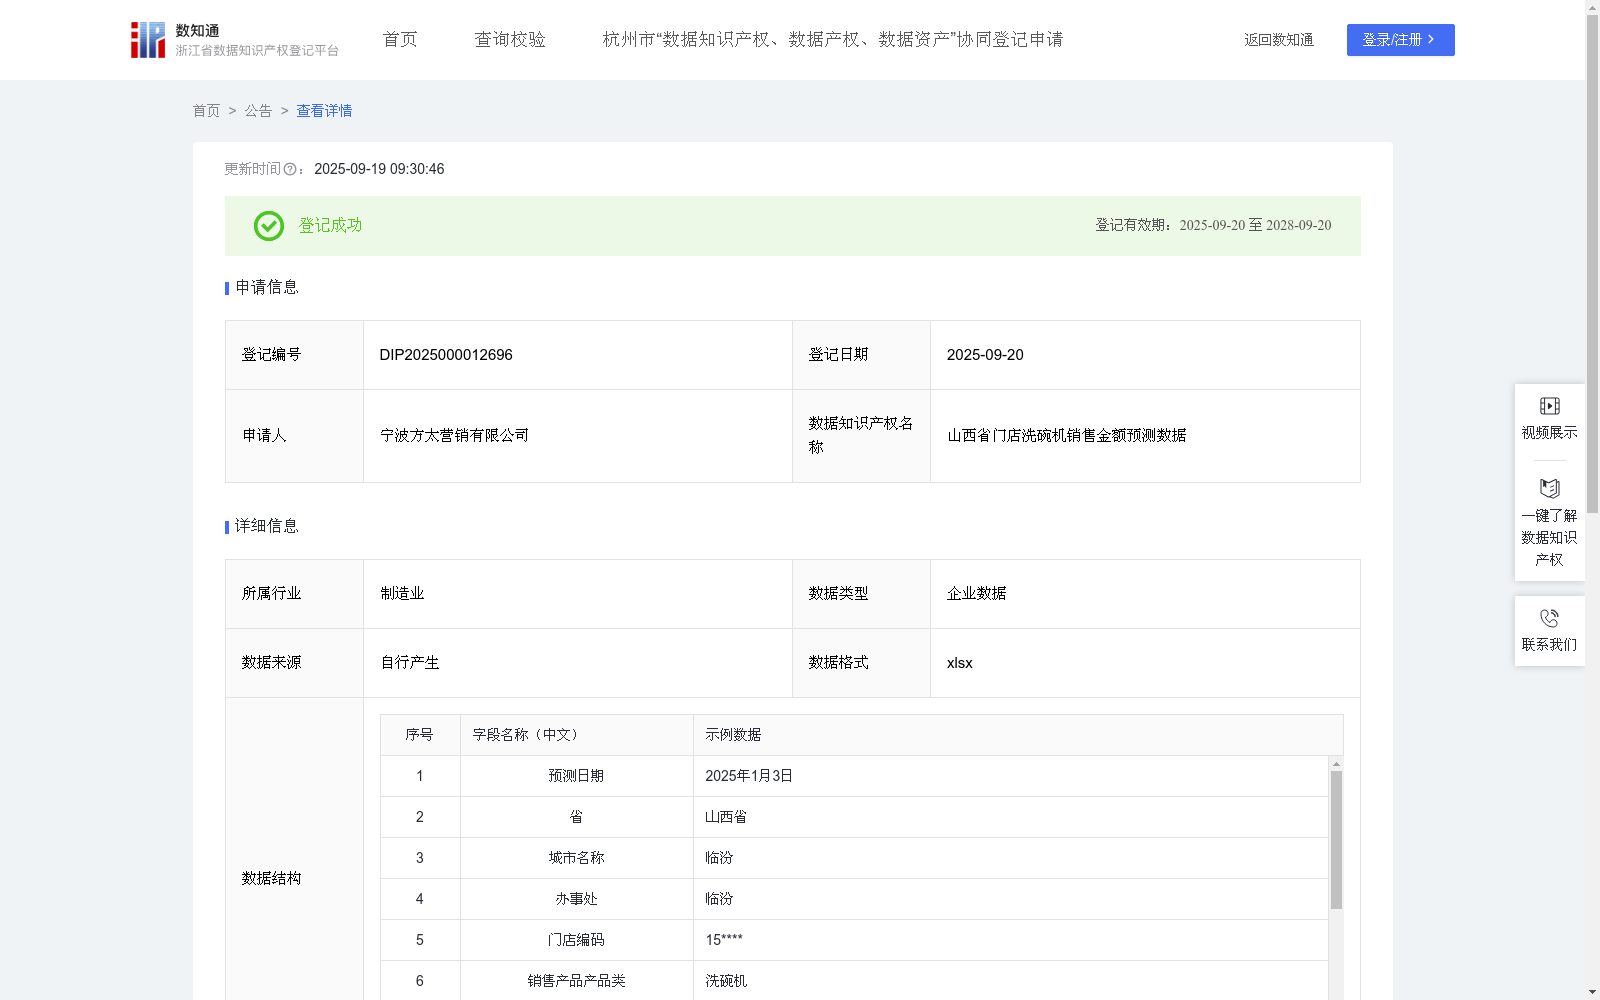
山西省门店洗碗机销售金额预测数据
收藏浙江省数据知识产权登记平台2025-09-19 更新2025-09-20 收录
下载链接:
https://www.zjip.org.cn/home/announce/trends/182569
下载链接
链接失效反馈官方服务:
资源简介:
本数据通过整合山西省各个办事处下的各个门店预测月前六个月的洗碗机产品的审核订单金额数据,结合地区和时间构建了门店零售业务的销售金额预测模型,为各个相关方提供了决策支持。对于供应链来说,基于销售收入预测,公司能够指导供应链端排产计划制定,优化生产资源配置。合理规划生产资源投入,科学制定生产计划,从原材料采购、生产线调配到成品仓储管理,实现全流程的精细化管控,确保产品供应既能满足市场需求,又避免因产能过剩造成资源浪费,有效提升资源利用效率。对于营销端,结合区域销售预测结果,公司可以深入洞察不同地区的消费潜力与市场竞争态势,精准定位目标市场,制定差异化的销售策略与市场推广计划。针对消费能力较强的地区、加大产品的推广力度。适用于具备历史销售数据的零售业务场景,但不可用于无历史数据的新品预测或应对突发重大事件。1.数据收集和预处理:(1)数据收集:收集预测月前六个月录入的洗碗机订单的历史数据,以门店为颗粒度,涵盖各门店的订单金额、时间维度及地区属性等信息。 (2)数据预处理:对原始数据进行清洗,去除缺失值和异常数据,并对业务数据进行匿名化处理,确保符合数据安全规范。 2.地区差异分析:(1)趋势成分分析:分析数据中每个月的趋势成分。(2)地区差异分析:以整体地区为维度,分析不同地区间的销售差异效应,分析地区因素对销量的影响。 3.构建审核转开票矩阵与权重计算:(1)矩阵构建:结合历史实际审核数据,构建审核转开票矩阵。(2)权重计算:基于矩阵分析每个办事处每个过去月份的趋势性,计算对应的权重系数,反映各月份数据对预测的影响程度。4. 预测模型构建与结果输出:(1)模型构建:以门店为颗粒度,基于过去6个月的审核订单金额数据,结合趋势分析结果和地区差异调整因子,构建对于每个地区门店的销售金额预测模型。(2)预测输出:利用模型预测未来一个月各个门店的销售额,并通过审核金额权重系数计算最终收入预测值,输出各门店的销售额预测结果。以临汾的门店为例,本月预测销售金额(万元)=0.0000*预测月前6个月审核金额(万元)+0.0000*预测月前5个月审核金额(万元)+0.0536*预测月前4个月审核金额(万元)+0.1165*预测月前3个月审核金额(万元)+0.4329*预测月前2个月审核金额(万元)+0.7502*预测月前1个月审核金额(万元)。
This dataset integrates the audited order amount data of dishwasher products from each store under every regional office in Shanxi Province for the six months prior to the forecast month, and constructs a sales amount forecast model for store retail business by combining regional and temporal dimensions, providing decision support for all relevant stakeholders. For the supply chain, based on sales revenue forecasts, the company can guide the formulation of supply chain production scheduling plans and optimize the allocation of production resources. By rationally planning production resource input and scientifically formulating production plans, from raw material procurement, production line allocation to finished product warehouse management, refined control over the entire process can be achieved, ensuring that product supply meets market demand while avoiding resource waste caused by overcapacity and effectively improving resource utilization efficiency. For the marketing side, combined with regional sales forecast results, the company can gain in-depth insights into the consumption potential and market competition landscape of different regions, accurately position target markets, and formulate differentiated sales strategies and marketing promotion plans, and increase product promotion efforts in regions with strong consumption capacity. This dataset is applicable to retail business scenarios with available historical sales data, but cannot be used for new product forecasting without historical data or to respond to sudden major emergencies.
1. Data Collection and Preprocessing:
(1) Data Collection: Collect historical data of dishwasher orders entered in the six months prior to the forecast month at the store-level granularity, covering information such as each store's order amount, time dimension, and regional attributes.
(2) Data Preprocessing: Clean the original data, remove missing values and abnormal data, and anonymize the business data to ensure compliance with data security regulations.
2. Regional Difference Analysis:
(1) Trend Component Analysis: Analyze the trend component of each month in the dataset.
(2) Regional Difference Analysis: At the regional aggregate level, analyze the sales difference effects between different regions and the impact of regional factors on sales volume.
3. Construction of Audit-to-Invoicing Matrix and Weight Calculation:
(1) Matrix Construction: Combine historical actual audit data to construct an audit-to-invoicing matrix.
(2) Weight Calculation: Analyze the trend characteristics of each past month for each regional office based on the matrix, and calculate the corresponding weight coefficients to reflect the influence degree of each month's data on the forecast.
4. Forecast Model Construction and Result Output:
(1) Model Construction: At the store-level granularity, based on the audited order amount data of the past six months, combined with trend analysis results and regional difference adjustment factors, construct a sales amount forecast model for each store in every region.
(2) Forecast Output: Use the model to forecast the sales amount of each store in the coming month, calculate the final revenue forecast value using the audited amount weight coefficients, and output the sales forecast results of each store. Take the store in Linfen as an example:
Predicted sales amount for the current month (ten thousand yuan) = 0.0000 * Audited amount six months prior to the forecast month (ten thousand yuan) + 0.0000 * Audited amount five months prior to the forecast month (ten thousand yuan) + 0.0536 * Audited amount four months prior to the forecast month (ten thousand yuan) + 0.1165 * Audited amount three months prior to the forecast month (ten thousand yuan) + 0.4329 * Audited amount two months prior to the forecast month (ten thousand yuan) + 0.7502 * Audited amount one month prior to the forecast month (ten thousand yuan).
提供机构:
宁波方太营销有限公司
创建时间:
2025-07-29
搜集汇总
数据集介绍
背景与挑战
背景概述
该数据集由宁波方太营销有限公司提供,包含785条记录,每月更新,聚焦于山西省门店洗碗机销售金额的预测。数据涵盖预测月前6个月的审核金额和本月预测值,用于构建销售预测模型,支持供应链资源优化和营销策略制定,适用于有历史数据的零售业务场景。
以上内容由遇见数据集搜集并总结生成


