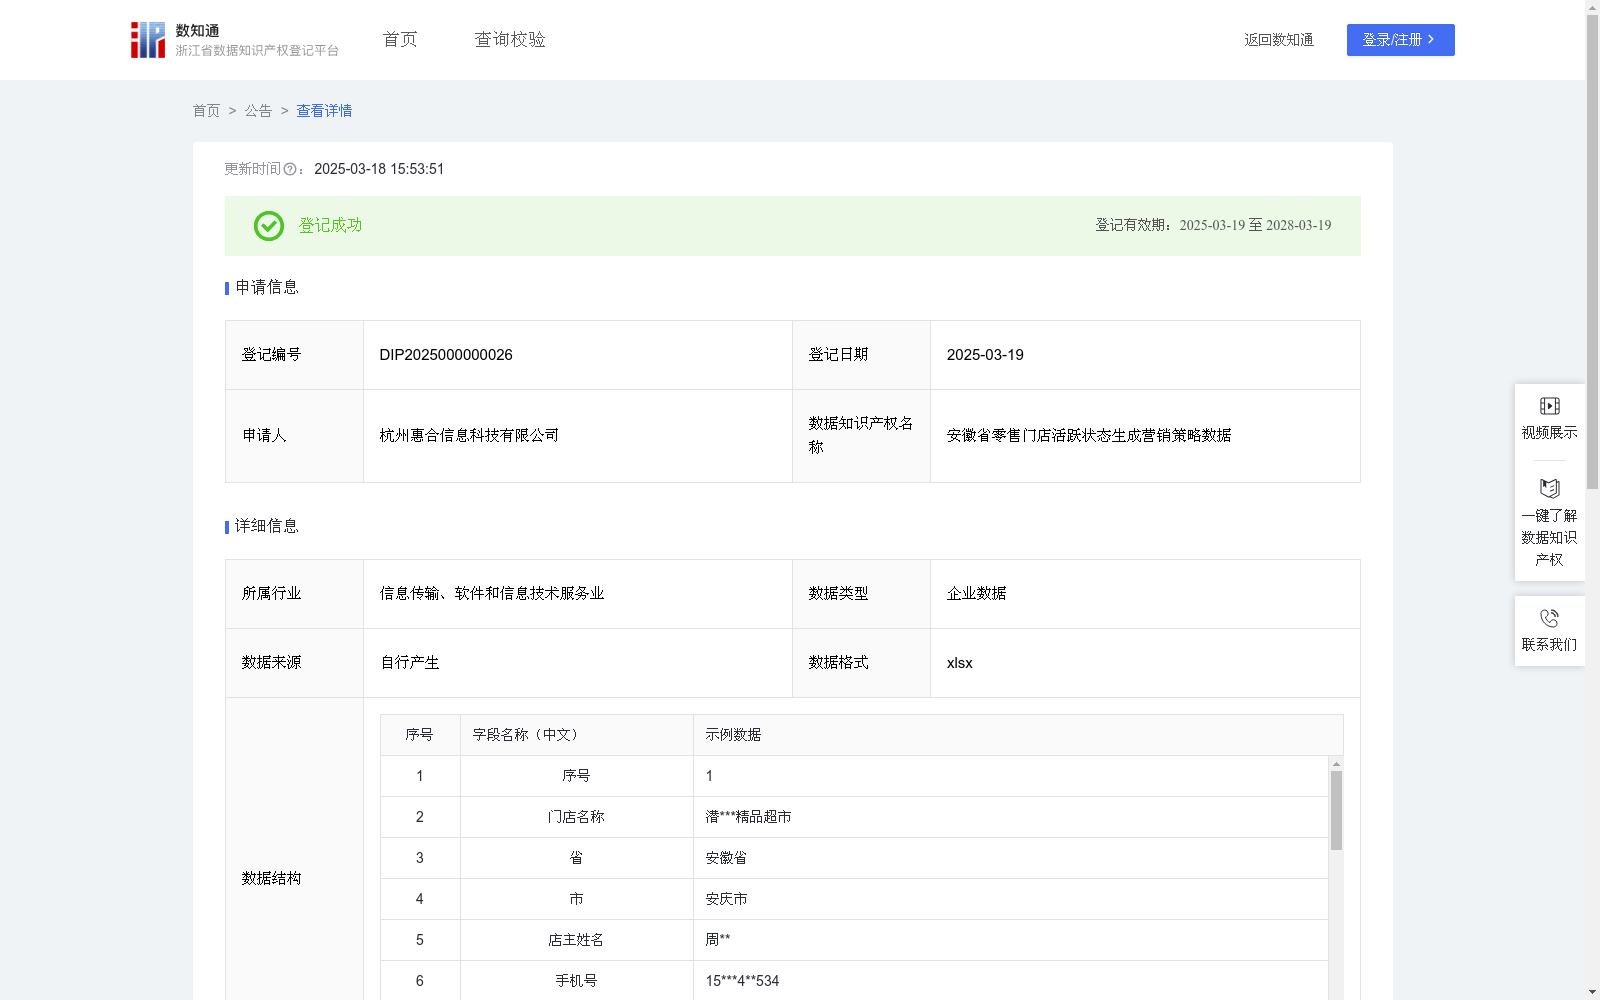
安徽省零售门店活跃状态生成营销策略数据
收藏浙江省数据知识产权登记平台2025-03-18 更新2025-03-19 收录
下载链接:
https://www.zjip.org.cn/home/announce/trends/118163
下载链接
链接失效反馈官方服务:
资源简介:
本数据通过安徽省内零售门店用户年度内活跃状态,结合数据模型为多领域品牌针对不同活跃状态、不同区域开展营销策略提供数据支持。通过本单位自有的e店佳等系统,根据算法确定省内区域及门店活跃价值度,指导品牌制定更具针对性的个性化营销策略,优化成本效益。该数据方法可广泛应用于各种零售品牌,以及需要研究零售门店/实体经济营销模式的单位部门,有助于通过此类分析数据来制定个性化营销策略,节省成本、提升营销效果。1.数据处理:通过惠合科技合法自有的e店佳等店商平台,以统计时间为基准,以已在活动平台注册的安徽省门店用户为对象,分析一年内,数据对象参与平台上投放的品牌营销活动的数据,利用IF函数进行活跃度的初步判断,IF【一年期内未参加】,则门店/用户活跃状态记为"/".IF【最近1个月内有登录/参与活动记录】,则门店/用户活跃状态记为“1个月内活跃”,以此类推划分成【/】、【1个月内活跃】、【1~3月内活跃】、【3~6月内活跃】、【6~12月内活跃】五个类型,分别用记为/区间、A区间、B区间、C区间、D区间。A、B区间,则门店评价为高活跃度门店;C、D区间则门店评价为一般活跃度门店;/区间则门店评价为低活跃度门店;2.数据计算:利用∑函数计算不同活跃区间类型的门店总数,计算不同活跃状态区间门店总数的占比,某区间门店占比=活跃状态区间为某类型的门店总数/某省参与统计门店总数*100%(例如:本年A区间门店占比=本年活跃状态区间为A的门店总数/本年安徽省参与统计门店总数*100%),IF【90%≤A区间门店占比<100%】,则区域评价为“高活跃度省份”;IF【70%≤A区间门店占比<90%】,则区域评价为“一般活跃度省份”;IF【0<A区间门店占比<70%】,则区域评价为“低活跃度省份”(根据实际情况,不存在占比0以及100%的情况);3.数据复用:本数据的使用分为两步,首先通过算法计算对区域完成评价,加强对高活跃度省份的营销投入,减少对低活跃度省份的营销成本投入,投放产品优惠性营销稳定一般活跃度省份;第二步在省份评价的基础上对零售门店进行进一步的分析,结合地域差异(气候,经济发展情况,受众区别,客户偏好等)进行精准营销,根据零售门店活跃状态生成有针对性、可推广性的营销策略。
This dataset provides data support for multi-sector brands to develop targeted marketing strategies across different activity statuses and regions, based on the annual activity status of retail store users in Anhui Province and combined with data models. Using systems such as the legally self-owned e-Dianjia system of Huihe Technology, algorithms are employed to determine the regional and store activity value within the province, guiding brands to formulate more personalized and targeted marketing strategies and optimize cost-effectiveness. This data methodology can be widely applied to various retail brands and units/departments that need to study retail store/real economy marketing models, helping to formulate personalized marketing strategies, reduce costs and improve marketing outcomes through such analytical data.
1. Data Processing: Using retailer platforms such as e-Dianjia legally owned by Huihe Technology, based on the statistical timeline, taking Anhui retail store users who have registered on the activity platform as research objects, this part analyzes the data of the research objects' participation in brand marketing activities launched on the platform over one year. The IF function is used to initially judge the activity level: if the user/store did not participate within one year, the activity status is marked as "/"; if the user/store has logged in or participated in activities within the latest 1 month, the activity status is marked as "Active within 1 month". Following this rule, five categories are divided: [/], [Active within 1 month], [Active within 1–3 months], [Active within 3–6 months], [Active within 6–12 months], which are respectively marked as / Interval, Interval A, Interval B, Interval C, Interval D. Stores in Interval A and B are evaluated as high-activity stores; those in Interval C and D are evaluated as medium-activity stores; those in / Interval are evaluated as low-activity stores.
2. Data Calculation: The SUM (Σ) function is used to calculate the total number of stores in different activity interval categories, and calculate the proportion of stores in each activity status interval. The proportion of stores in a certain interval = (total number of stores with activity status of a certain type / total number of stores participating in the statistics of a certain province) * 100%. For example: the proportion of stores in Interval A this year = (total number of stores with activity status of A this year / total number of stores participating in the statistics in Anhui Province this year) * 100%. The region is evaluated as "high-activity province" if 90% ≤ proportion of stores in Interval A < 100%; "medium-activity province" if 70% ≤ proportion of stores in Interval A < 90%; "low-activity province" if 0 < proportion of stores in Interval A < 70% (according to actual conditions, cases with 0% or 100% proportion do not exist).
3. Data Reuse: The application of this dataset is divided into two steps. First, complete regional evaluation through algorithmic calculation: increase marketing investment in high-activity provinces, reduce marketing cost input in low-activity provinces, and launch preferential product marketing to stabilize medium-activity provinces. Second, conduct further analysis of retail stores based on the provincial evaluation, carry out precision marketing combined with regional differences (including climate, economic development level, audience differences, customer preferences, etc.), and generate targeted and promotable marketing strategies based on the activity status of retail stores.
提供机构:
杭州惠合信息科技有限公司
创建时间:
2025-01-03
搜集汇总
数据集介绍
背景与挑战
背景概述
该数据集包含安徽省501家零售门店的活跃状态数据,通过算法划分活跃度区间并生成评价,旨在为品牌提供精准营销策略支持。数据每年更新,适用于零售品牌及研究零售营销模式的单位。
以上内容由遇见数据集搜集并总结生成


