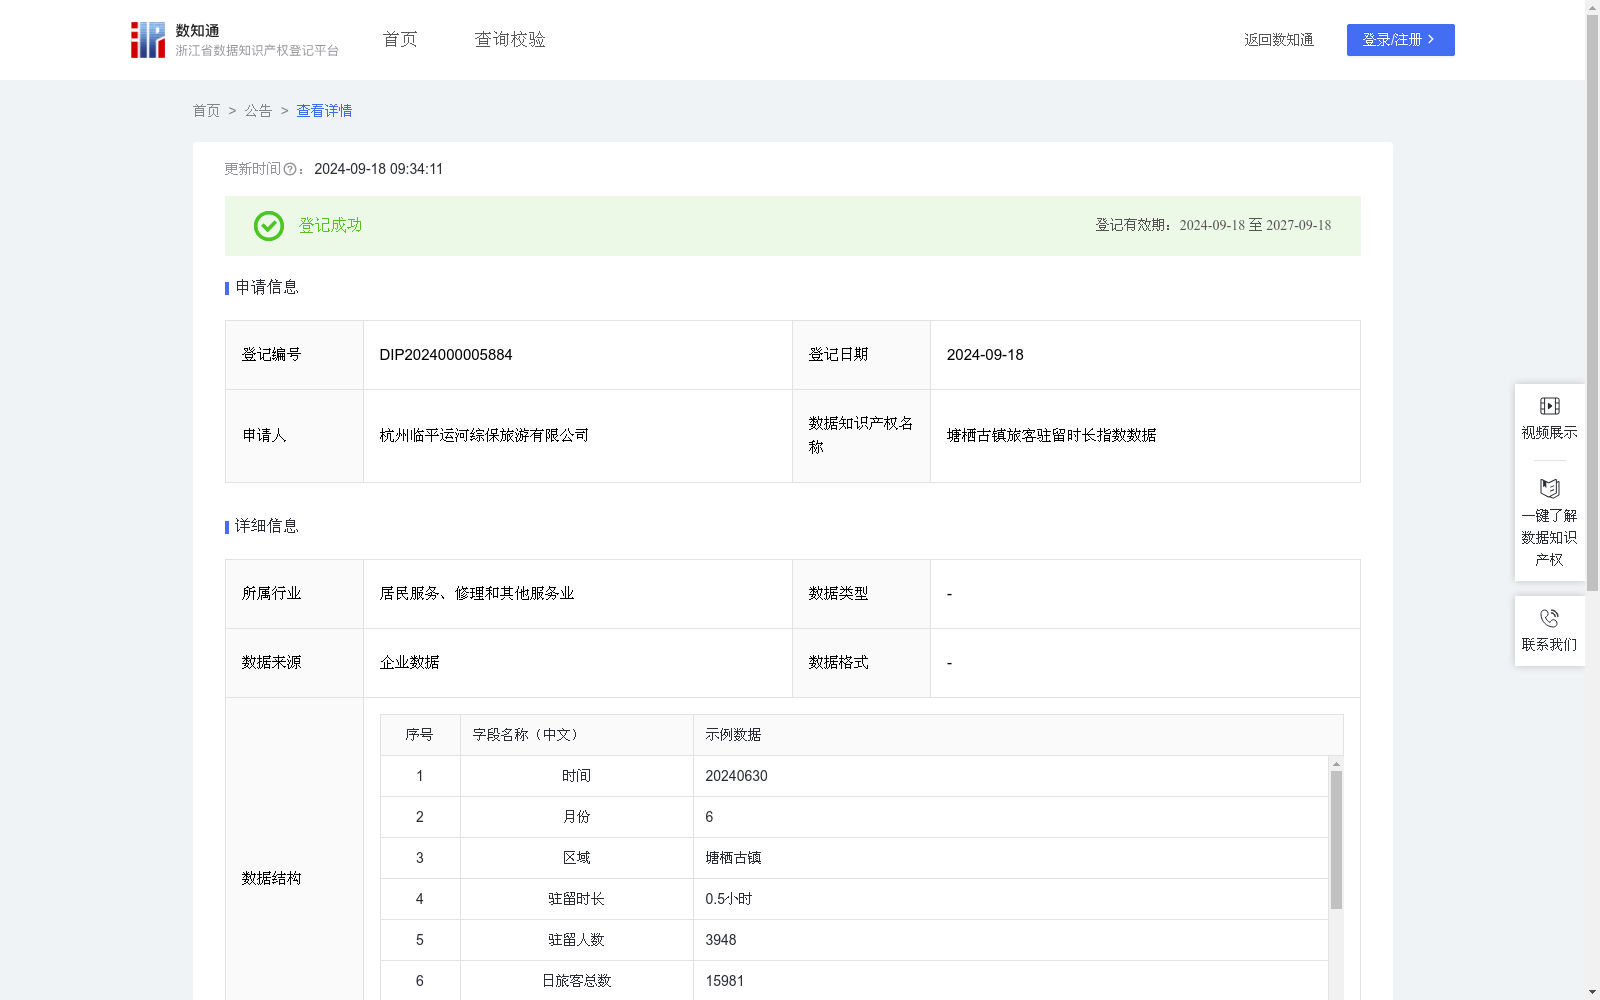
塘栖古镇旅客驻留时长指数数据
收藏资源简介:
驻留时长是衡量旅游体验质量的重要指标之一,分析了解旅客驻留时长的分布,有助于评估旅游活动对当地生态环境的压力,帮助城市管理者合理规划基础设施,制定合理的旅游容量控制措施,从而实现旅游业的可持续发展,提升旅游目的地的吸引力和竞争力。(1)数据采集:利用杭州市临平区塘栖古镇运营平台系统导出2024年1月到6月旅客驻留时长数据。 (2)数据处理:对数据进行清洗、去除无效数据和极限数据等操作,将驻留时长分为6类。 (3)数据加工:用SUM函数计算单日旅客数A、单月旅客数B,用LOOKUP函数查询出前一日旅客数C、前一月旅客数D,通过A、C计算旅客数日环比E,通过B、D计算旅客数月环比F。主观赋权法对不同驻留时长赋权重X,驻留时长越久权重X越大,∑(X1 to X6)=1,计算单日不同驻留时长指数和日驻留总指数Y=SUM(0.5小时驻留人数*X1+...+8~24小时驻留人数*X6)。 (4)数据应用:E、F、G值结合时间直观反映不同驻留时长旅客增长趋势,驻留总指数Y越大当日旅客的价值越高。
Length of stay is one of the critical indicators for evaluating the quality of tourism experience. Analyzing the distribution of tourists' length of stay helps assess the pressure exerted by tourism activities on the local ecological environment, enables urban managers to rationally plan infrastructure and formulate appropriate tourism capacity control measures, thereby realizing the sustainable development of tourism and enhancing the attractiveness and competitiveness of tourism destinations. (1) Data Collection: Export the tourists' length of stay data from January to June 2024 via the operation platform system of Tangqi Ancient Town, Linping District, Hangzhou. (2) Data Processing: Clean the dataset, remove invalid and extreme values, and classify the length of stay into 6 categories. (3) Data Calculation: Use the SUM function to calculate the daily tourist volume A and monthly tourist volume B; use the LOOKUP function to query the previous day's tourist volume C and previous month's tourist volume D. Calculate the daily month-on-month growth rate E of tourists based on A and C, and the monthly month-on-month growth rate F based on B and D. Assign weights X to different lengths of stay using the subjective weighting method, where a longer stay duration corresponds to a higher weight X, satisfying ∑(X₁ to X₆) = 1. Calculate the daily index sum for different stay durations and the total daily stay index Y = SUM(0.5-hour stay population * X₁ + ... + 8–24-hour stay population * X₆). (4) Data Application: The values of E, F, and G, combined with temporal dimensions, intuitively reflect the growth trends of tourists with different stay durations; the larger the total stay index Y, the higher the value of the tourists on that day.