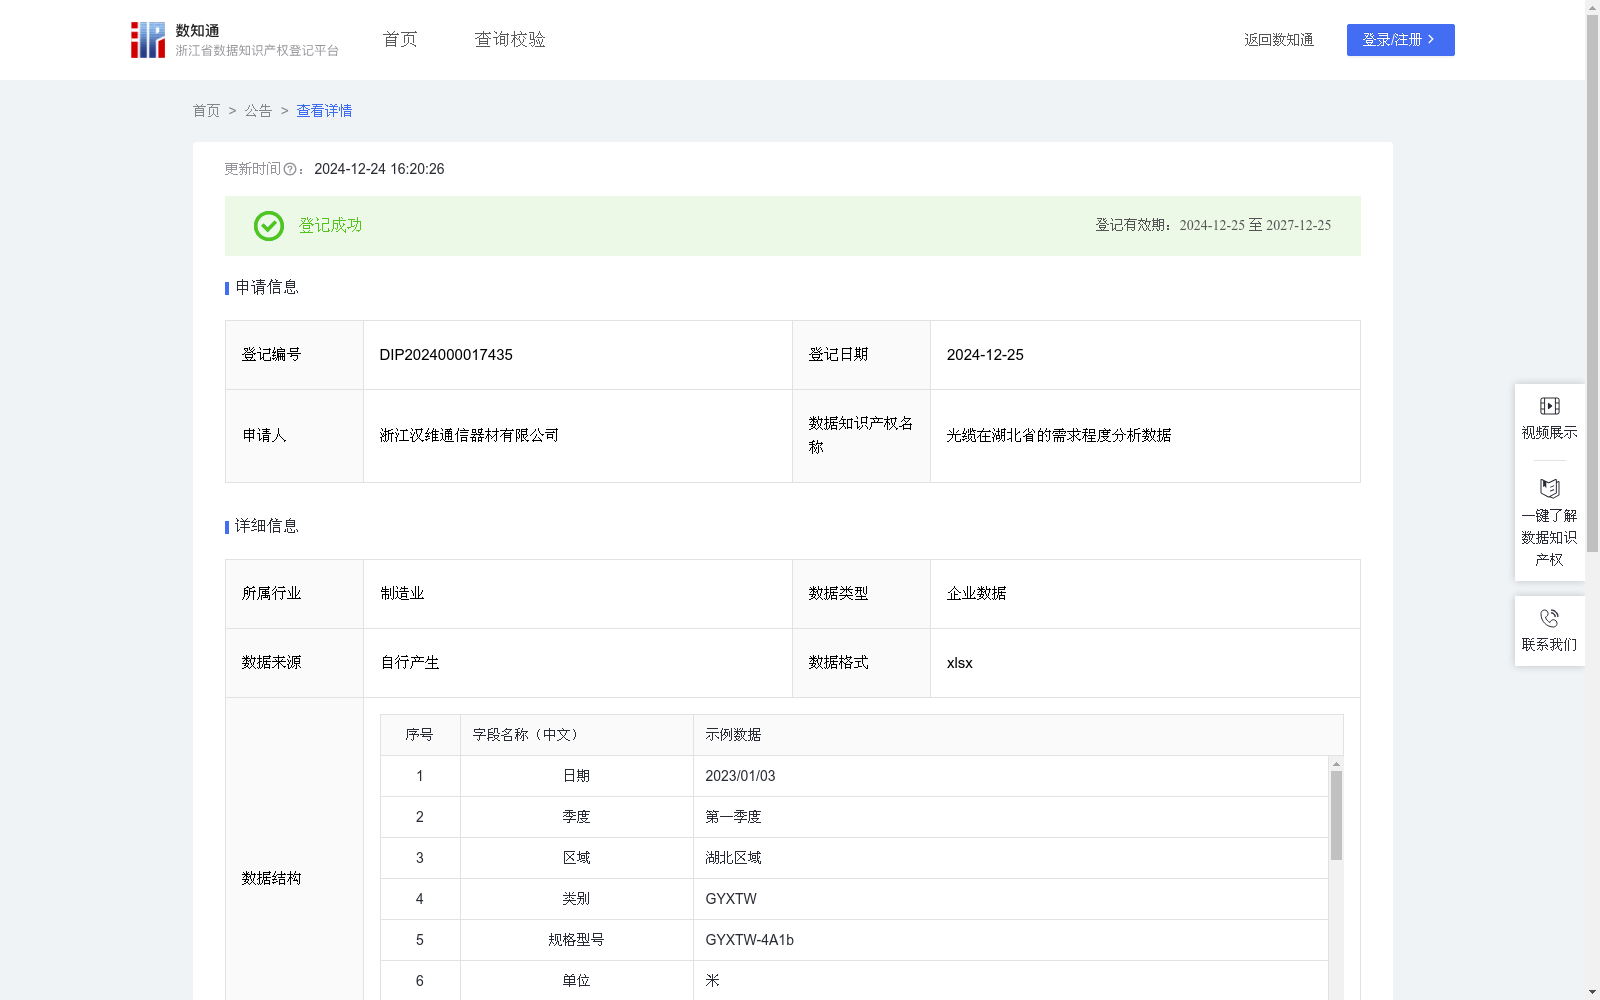
光缆在湖北省的需求程度分析数据
收藏浙江省数据知识产权登记平台2024-12-24 更新2024-12-25 收录
下载链接:
https://www.zjip.org.cn/home/announce/trends/108231
下载链接
链接失效反馈官方服务:
资源简介:
本数据通过分析光缆产品在湖北省全年的贸易情况,可以清晰地了解本地市场规模及其变化趋势,为制定市场进入策略和长期发展规划提供数据支持;利用该数据来指导战略方向的制定,确保资源投入能够聚焦于提升企业竞争能力的关键环节;利用该数据了解和分析产品的需求变化情况,来衡量企业在本地的市场竞争力,从而优化和调整企业策略,调整销售渠道布局,制定更加精准的营销策略,为客户提供针对性的指导意见,提升客户满意度和忠诚度;还有助于企业进行市场细分,更好地理解本地市场需求和技术趋势,并针对不同市场推出更具针对性的产品,从而推动产品的创新。1、收集记录2023年光缆产品全年交易记录,以产品类别为分析维度来判断不同光缆产品的需求情况,数据中同一产品名称均包含数十种规格型号,每条数据的时间、季度、区域、类别、规格型号、数量字段为一次交易中的一个产品信息。
2、使用sum函数将本数据统计范围内的所有产品交易数量相加,计算全年总交易数量,使用sumif函数计算本类别产品各季度的交易数量。
3、计算产品每季度的交易占比:本类别产品某季度交易占比=(本类别产品该季度交易数量/全年总交易数量)*100%;
4、先求和再计算各产品占比的平均值:百分比平均值AVG =(本类别产品一季度交易占比+...+本类别产品四季度交易占比)/4。
5、计算方差:S = [(本类别产品一季度交易占比-AVG)²+...+(本类别产品四季度交易占比-AVG)²]/4。
6、计算标准差:σ= sqrt(S)。
7、根据各产品四个季度的交易情况,程序依据以上算法自动计算得出该产品需求程度:当σ小于2,当前商品为高需求商品,当σ大于等于2并且小于等于5,当前商品为中等需求商品,其余的为低需求商品。
This dataset is compiled by analyzing the annual trade situation of optical cable products in Hubei Province, which enables clear insight into the local market scale and its evolving trends, providing data support for formulating market entry strategies and long-term development plans. It can be used to guide the formulation of strategic directions, ensuring that resource investment focuses on key segments that enhance enterprise competitiveness; analyze changes in product demand to measure the enterprise's local market competitiveness, thereby optimizing and adjusting enterprise strategies, adjusting sales channel layouts, formulating more precise marketing strategies, providing targeted guidance for customers, and improving customer satisfaction and loyalty. It also assists enterprises in conducting market segmentation, better understanding local market demand and technological trends, and launching more targeted products for different market segments, thereby promoting product innovation.
1. Collect and record the full-year transaction records of optical cable products in 2023, taking product categories as the analytical dimension to assess the demand status of different optical cable products. Each product name in the dataset covers dozens of specifications and models, and the fields of time, quarter, region, category, specification and model, and transaction quantity in each record represent the information of one product in a single transaction.
2. Use the SUM function to sum the transaction quantities of all products within the statistical scope of this dataset to calculate the annual total transaction quantity, and use the SUMIF function to calculate the quarterly transaction quantity for each product category.
3. Calculate the quarterly transaction proportion of products: the quarterly transaction proportion of a given product category = (the quarterly transaction quantity of this product category / annual total transaction quantity) * 100%
4. Calculate the average percentage value: the percentage average AVG = (the quarterly transaction proportion of this product category in Q1 + ... + the quarterly transaction proportion of this product category in Q4) / 4
5. Calculate the variance: S = [(the quarterly transaction proportion of this product category in Q1 - AVG)² + ... + (the quarterly transaction proportion of this product category in Q4 - AVG)²] / 4
6. Calculate the standard deviation: σ = sqrt(S)
7. Based on the four-quarter transaction status of each product, the program automatically calculates the demand level of the product using the above algorithm: when σ < 2, the current product is a high-demand product; when 2 ≤ σ ≤ 5, the current product is a medium-demand product; all remaining cases are classified as low-demand products.
提供机构:
浙江汉维通信器材有限公司
创建时间:
2024-11-29
搜集汇总
数据集介绍
以上内容由遇见数据集搜集并总结生成


