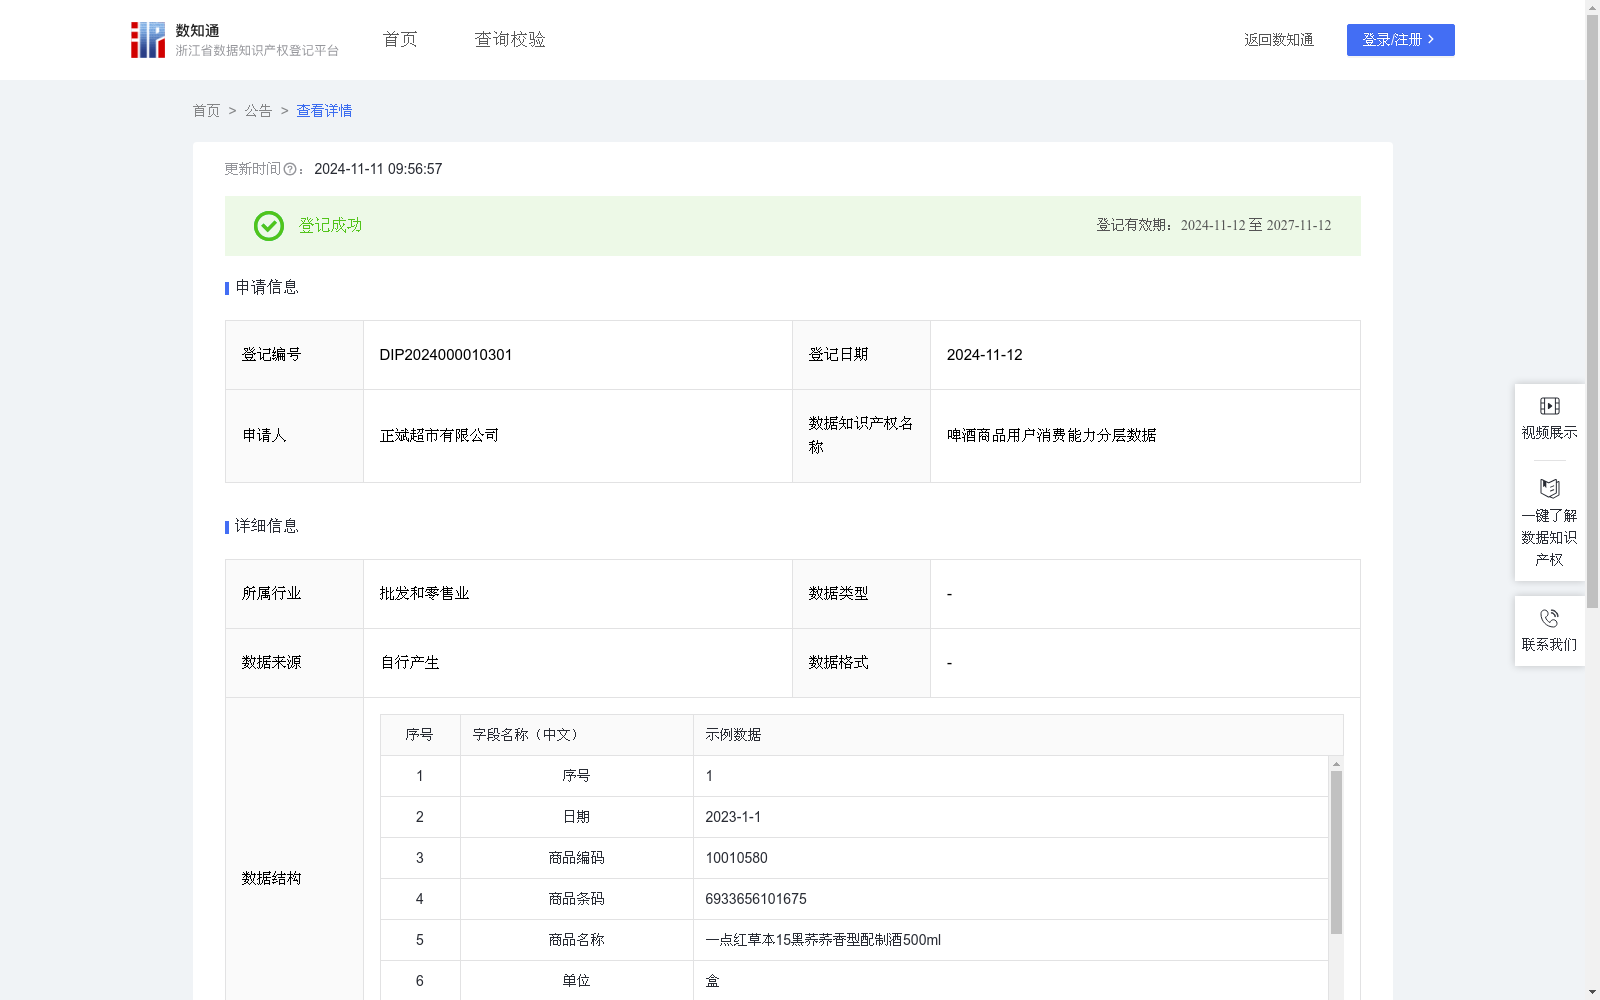
啤酒商品用户消费能力分层数据
收藏浙江省数据知识产权登记平台2024-11-11 更新2024-11-12 收录
下载链接:
https://www.zjip.org.cn/home/announce/trends/82832
下载链接
链接失效反馈官方服务:
资源简介:
通过对历史下单用户收集数据分析,了解该地区客户对啤酒商品的消费情况,对用户进行标签制定,定位用户消费级别,了解客户在那些月份啤酒消费占比率较高,从而了解该产品在那些月份最为畅销,为本地区的所有批发、零售行业制定采购、销售策略,更好地为用户提供个性化的商品和服务。1、用户消费啤酒商品数量占总消费酒类商品数量的比例=用户消费啤酒商品数量/总消费酒类商品数量*100%;2、用户消费占总消费的比例按从大到小进行排名;3、消费分类运用ABCDEFG分类法,对占比大于等于6%以上的,给予“A类消费”分层;占比大于等于5%到小于6%区间的,则给予“B类消费”分层;占比在大于等于4%到小于5%区间,则给予“C类消费”分层。占比在大于等于3%到小于4%区间,则给予“D类消费”分层;占比在大于等于2%到小于3%区间,则给予“E类消费”分层;占比在大于等于1%到小于2%区间,则给予“F类消费”分层;占比在小于1%以下,则给予“G类消费”分层。
This dataset is developed to analyze local customers' beer consumption status by processing data collected from historical order-placing users, formulate user tags, identify their consumption levels, figure out the months with relatively high beer consumption proportions, and thus determine the peak sales months of beer products. The results will help formulate procurement and sales strategies for all wholesale and retail industries in the local area, so as to better provide users with personalized products and services.
1. The ratio of a user's beer consumption quantity to their total alcoholic beverage consumption quantity = (User's beer consumption quantity / Total alcoholic beverage consumption quantity) * 100%;
2. Rank users' consumption ratios in descending order;
3. Adopt the ABCDEFG classification method for consumption tiering: users with a ratio ≥6% are categorized as "Class A consumers"; those with 5% ≤ ratio <6% as "Class B consumers"; 4% ≤ ratio <5% as "Class C consumers"; 3% ≤ ratio <4% as "Class D consumers"; 2% ≤ ratio <3% as "Class E consumers"; 1% ≤ ratio <2% as "Class F consumers"; and those with a ratio <1% as "Class G consumers".
提供机构:
正斌超市有限公司
创建时间:
2024-09-27
搜集汇总
数据集介绍
特点
该数据集包含47,149条啤酒商品用户消费记录,用于分析用户消费行为并进行消费能力分层。通过ABCDEFG分类法对用户进行分级,帮助批发和零售行业制定采购和销售策略。
以上内容由遇见数据集搜集并总结生成


