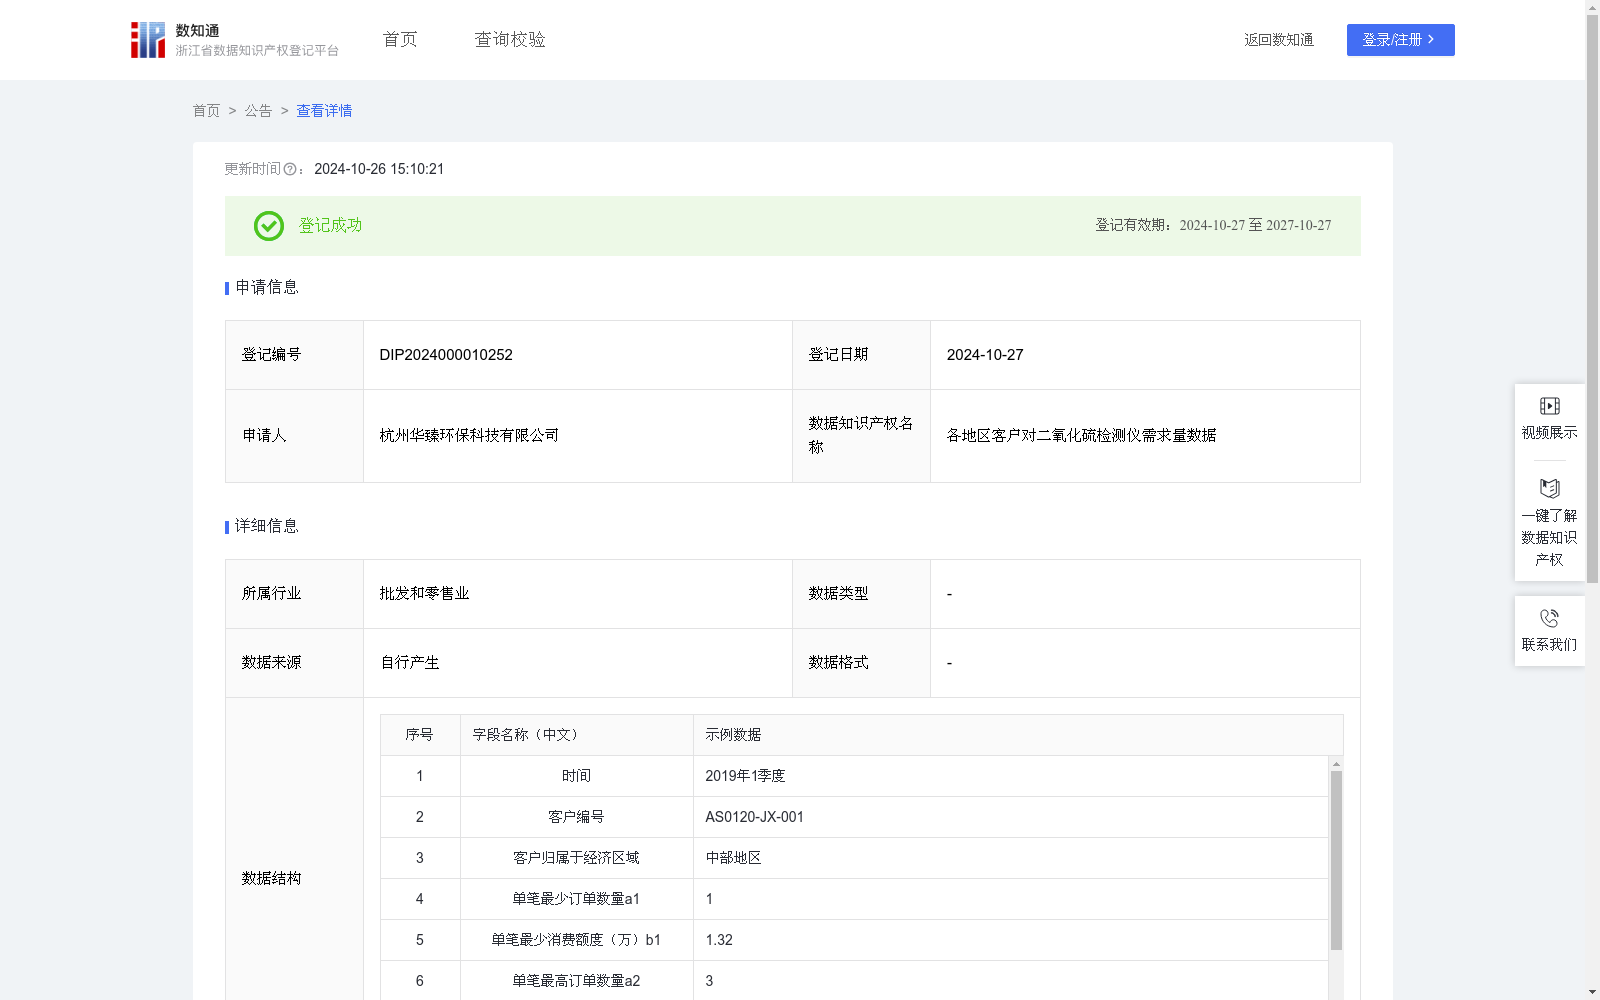
各地区客户对二氧化硫检测仪需求量数据
收藏浙江省数据知识产权登记平台2024-10-26 更新2024-10-27 收录
下载链接:
https://www.zjip.org.cn/home/announce/trends/76079
下载链接
链接失效反馈官方服务:
资源简介:
通过收集和分析各个客户对二氧化硫检测仪消费相关数据,了解客户对二氧化硫检测仪的购买力水平和消费偏好,从而了解该产品是否畅销,从而为本行业的所有客户制定生产策略,更好地为用户提供个性化的商品和服务,对于高等级客户可每月1至2次与之沟通,对于中等级客户可每季度1至2次与之客户沟通,对于低等级客户可每半年1至2次与之沟通,从而制定更精准的生产营销策略。1.数据采集:采集各季度各个客户对二氧化硫检测仪的相关交易数据。2.数据处理:对采集到数据进行分类、合并、累加,便于分析使用。3.算法加工:将处理后的数据进行需求量分析:需求指数P={a1(单笔最少订单数量)/b1(单笔最少消费额度)+a2(单笔最高订单数量)/b2(单笔最高消费额度)}*k,k为消费系数,客户归属于不同的经济区域k值不同,全国分为四大经济区域:东部地区、东北地区、中部地区和西部地区,按经验取值东部地区k值为1.1,东北和中部地区k值为1.15,西部地区k值为1.2。4、数据分类分级:根据计算出的需求指数P,将客户等级划分为“高、中、低”不同的类别和级别(2.5分及以上标记为“高等级”,1.5-2.5分区间内标记为“中等级”,1.5分及以下标记为“低等级”),帮助公司更好地理解客户。
This dataset is developed by collecting and analyzing customer consumption data related to sulfur dioxide detectors, to understand customers' purchasing power and consumption preferences for such detectors, evaluate the market popularity of the product, formulate production strategies for all clients in the industry, and better provide personalized products and services. Targeted communication schedules are also designed: 1 to 2 communications per month for high-tier customers, 1 to 2 communications per quarter for medium-tier customers, and 1 to 2 communications per half-year for low-tier customers, so as to develop more precise production and marketing strategies.
1. Data Collection: Collect transaction data related to sulfur dioxide detectors from each customer across all quarters.
2. Data Preprocessing: Classify, merge and aggregate the collected data to facilitate subsequent analysis work.
3. Algorithm-based Processing: Conduct demand analysis on the preprocessed data. The demand index P is calculated as: P = [(a1 / minimum single-order quantity / b1 / minimum single-order consumption amount) + (a2 / maximum single-order quantity / b2 / maximum single-order consumption amount)] * k, where k is the consumption coefficient. The value of k varies according to the economic region where the customer is located. The whole country is divided into four major economic regions: Eastern Region, Northeastern Region, Central Region and Western Region. Based on empirical values, the k value for the Eastern Region is 1.1, 1.15 for both the Northeastern and Central Regions, and 1.2 for the Western Region.
4. Data Classification and Grading: Divide customers into "high-tier", "medium-tier" and "low-tier" categories based on the calculated demand index P: customers with a score of 2.5 or above are marked as "high-tier", those with a score within the range of 1.5 to 2.5 are marked as "medium-tier", and those with a score of 1.5 or below are marked as "low-tier", to help the company better understand its customer base.
提供机构:
杭州华臻环保科技有限公司
创建时间:
2024-09-27
搜集汇总
数据集介绍
特点
该数据集记录了各地区客户对二氧化硫检测仪的需求情况,包含订单数量、消费额度、需求指数和客户等级等关键信息,用于分析客户购买力和消费偏好,支持生产营销策略的制定。数据规模为2135条,每季度更新一次。
以上内容由遇见数据集搜集并总结生成


