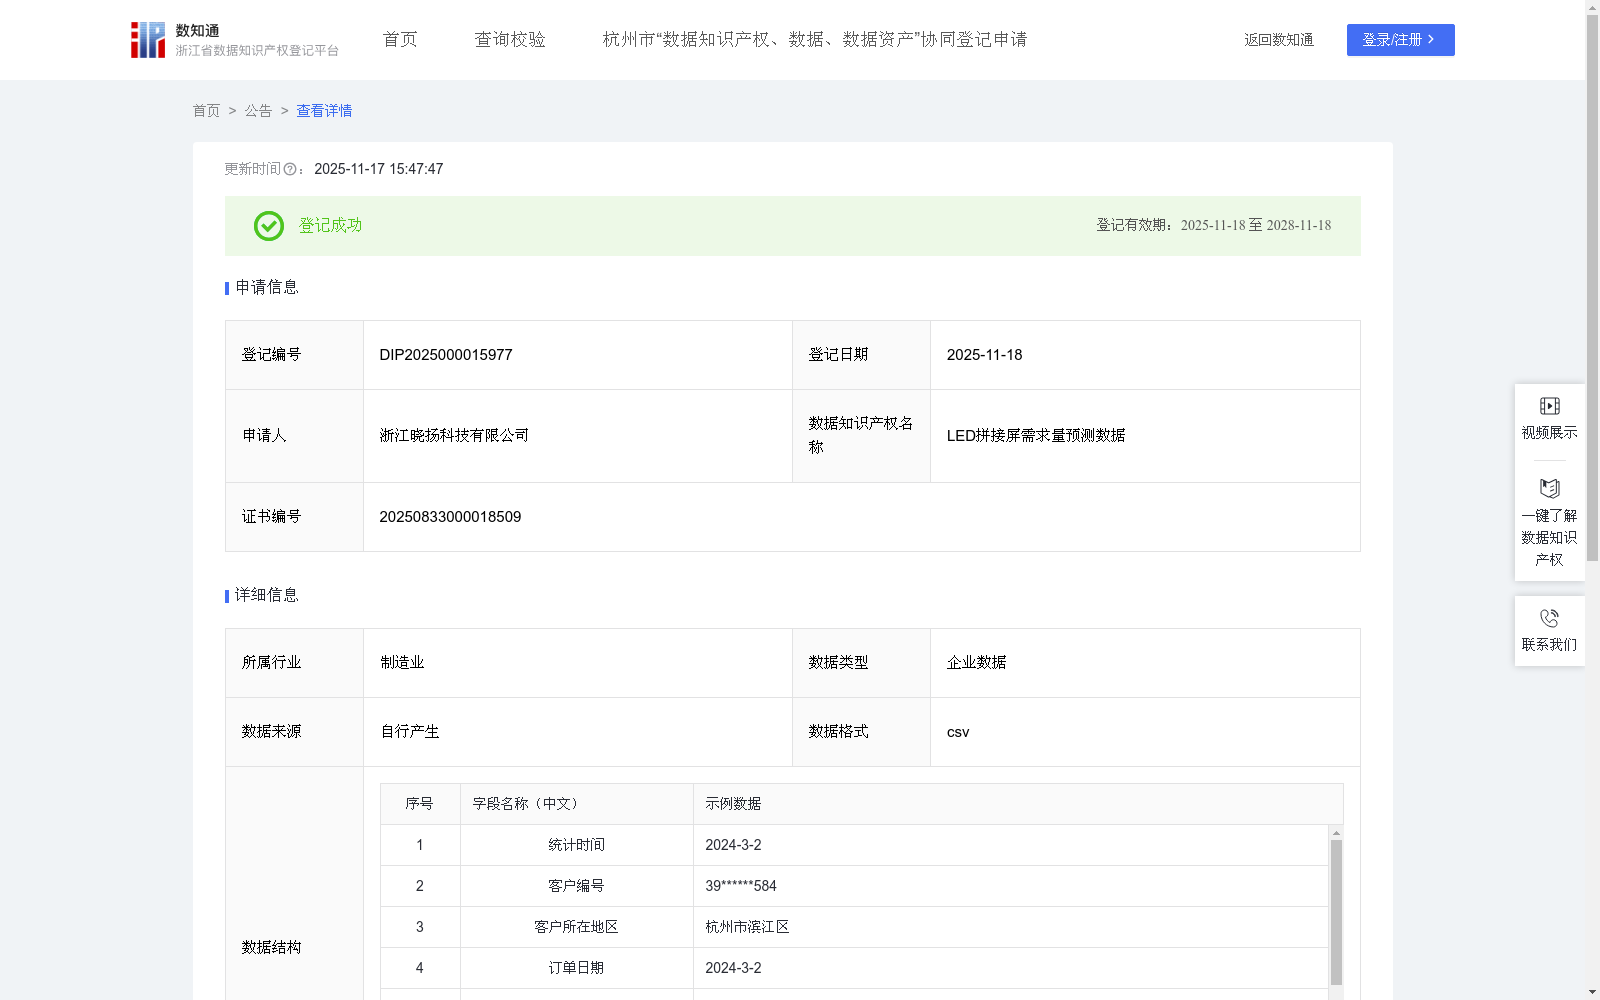
LED拼接屏需求量预测数据
收藏浙江省数据知识产权登记平台2025-11-17 更新2025-11-18 收录
下载链接:
https://www.zjip.org.cn/home/announce/trends/8400454
下载链接
链接失效反馈官方服务:
资源简介:
本数据聚焦于预测不同地区LED拼接屏的需求量,为公司及外部相关方提供了重要的决策依据,具有显著的应用价值。具体体现在以下方面:
1.优化库存与采购:对公司而言,通过需求量可以精准制定采购计划,合理控制库存水平,避免资金占用过多或产品短缺,提高供应链管理效率。
2.辅助生产与备货:对生产商而言,本预测数据可作为产能规划的重要参考,根据需求趋势调整生产节奏,避免产能过剩或供应不足,实现供应链高效协同。1. 数据采集
采集公司LED拼接屏的销售数据,包括统计时间、客户编号、客户所在地区、订单日期、订单数量(平方米)、订单金额(人民币元)。
2. 数据预处理
对采集的数据进行清洗,去除重复记录,处理缺失值。
3. 数据加工与分析
(1)计算历史需求量:使用SUMIFS函数对订单数量进行累加,分别计算出LED拼接屏过去365天、90天和30天的总需求量。 (2)建立需求量预测模型:未来30天LED拼接屏需求量预测值=[(过去365天总需求量÷365×a)+(过去90天的总需求量÷90×b)+(过去30天的总需求量÷30×c)]×30×k。其中,系数a=0.5,b=0.3,c=0.2,调整因子k=1.1。系数a、b、c反映数值对未来30天需求量预测的影响程度,由于算法更注重长期需求趋势的影响,因此a被赋予了最高的权重。调整因子k基于市场增长预期进行修正。
This dataset focuses on forecasting the demand for LED tiled displays in different regions, providing critical decision-making support for the company and external stakeholders, with substantial application value, which is reflected in the following aspects:
1. Optimize Inventory and Procurement: For the company, accurate procurement plans can be formulated based on demand forecasts to reasonably control inventory levels, avoid excessive capital occupation or product shortages, and improve supply chain management efficiency.
2. Assist Production and Stock Preparation: For manufacturers, this forecast data can serve as an important reference for capacity planning, adjust production rhythms according to demand trends, avoid overcapacity or insufficient supply, and achieve efficient supply chain collaboration.
1. Data Collection
Collect the sales data of the company's LED tiled displays, including statistical time, customer ID, customer's region, order date, order quantity (in square meters), and order amount (in CNY).
2. Data Preprocessing
Clean the collected data, remove duplicate records, and handle missing values.
3. Data Processing and Analysis
(1) Calculate historical demand: Use the SUMIFS function to accumulate the order quantity, and calculate the total demand of LED tiled displays over the past 365 days, 90 days, and 30 days respectively.
(2) Establish demand forecasting model: The 30-day future demand forecast value of LED tiled displays = [(Total demand over the past 365 days ÷ 365 × a) + (Total demand over the past 90 days ÷ 90 × b) + (Total demand over the past 30 days ÷ 30 × c)] × 30 × k. Among them, the coefficients a=0.5, b=0.3, c=0.2, and the adjustment factor k=1.1. The coefficients a, b, and c reflect the degree of influence of different time periods on the 30-day future demand forecast. Since the algorithm pays more attention to the impact of long-term demand trends, a is assigned the highest weight. The adjustment factor k is revised based on market growth expectations.
提供机构:
浙江晓扬科技有限公司
创建时间:
2025-08-18
搜集汇总
数据集介绍
背景与挑战
背景概述
该数据集是浙江晓扬科技有限公司登记的LED拼接屏需求量预测数据,包含518条CSV格式记录,每日更新。数据集通过历史销售数据计算过去365天、90天和30天的总需求量,并基于加权算法预测未来30天需求量,旨在帮助企业优化库存管理和生产规划,提高供应链效率。
以上内容由遇见数据集搜集并总结生成


