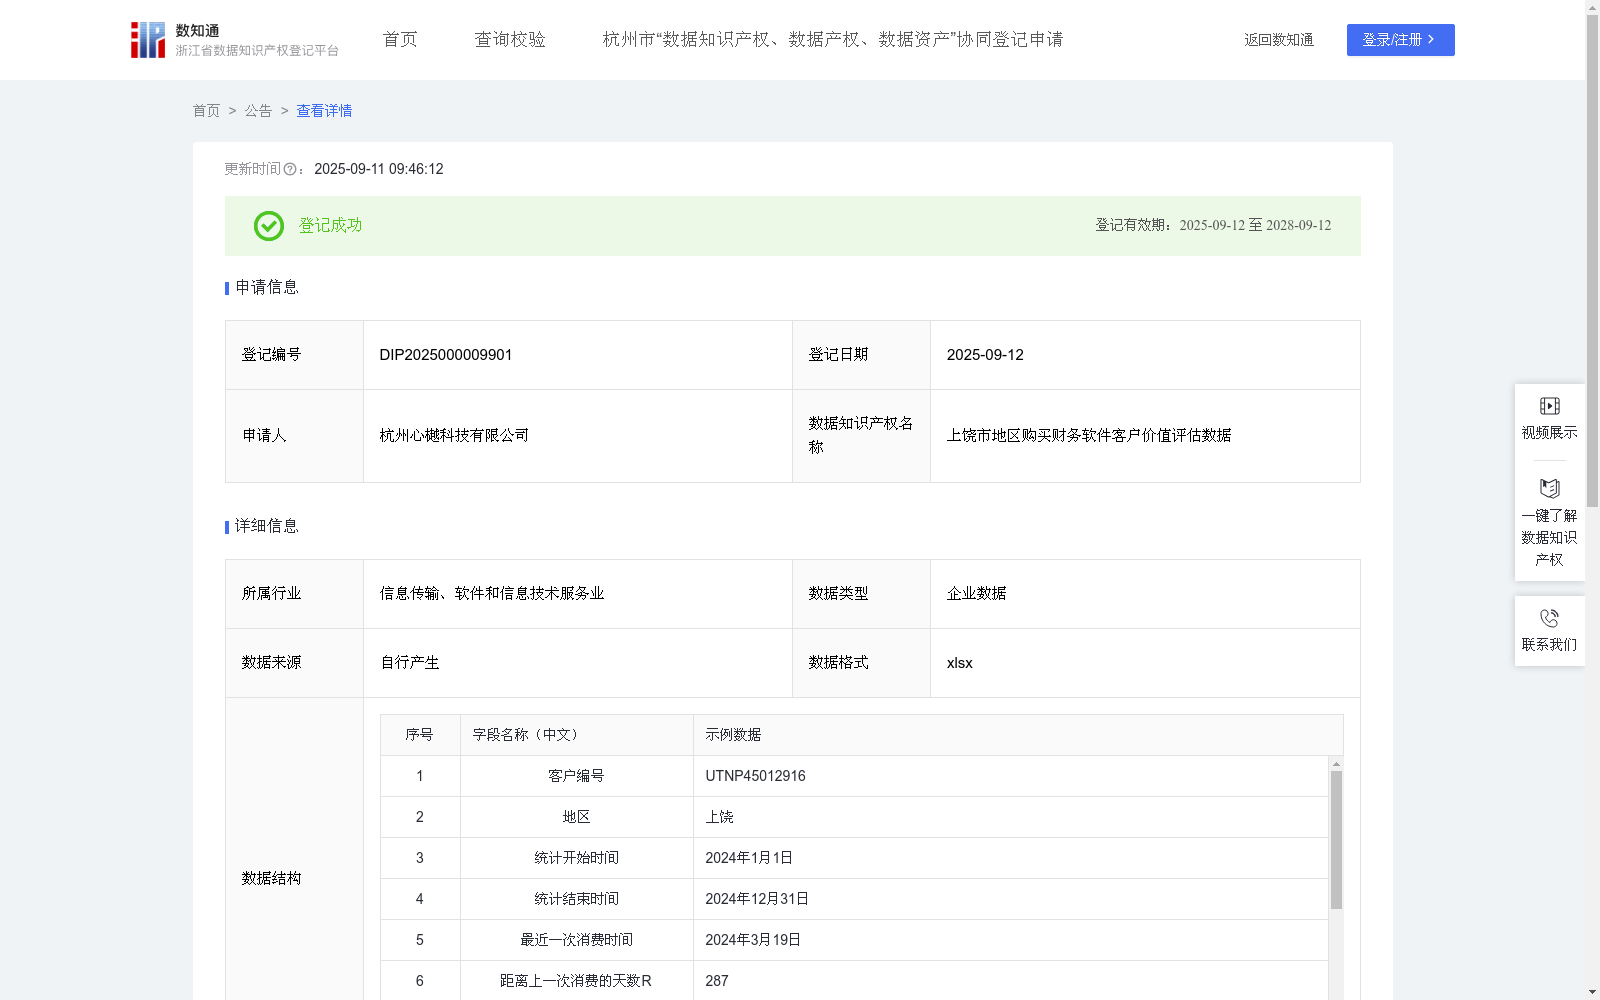
上饶市地区购买财务软件客户价值评估数据
收藏浙江省数据知识产权登记平台2025-09-11 更新2025-09-12 收录
下载链接:
https://www.zjip.org.cn/home/announce/trends/178471
下载链接
链接失效反馈官方服务:
资源简介:
采集销售记录表中上饶市地区的数据,通过客户距离上一次消费的天数R、统计时间内消费频次F和统计时间内消费金额M(元),采用RFM模型对客户进行价值评级,实现精准化运营。通过对上饶市地区客户价值分层管理,满足不同价值客户的个性化需求:- 对A级客户:每月进行一次回访维护,提供专属优惠和VIP服务,增强客户忠诚度;- 对B级客户:每季度进行一次回访维护,提供定制化产品推荐,提升客户价值;- 对C级客户:每半年进行一次回访维护,通过促销活动激活消费潜力;- 对D级客户:每年进行一次回访维护,评估客户流失风险,实施挽留策略。此外,该模型可为本地区客户群体高度重叠企业提供不同价值类型的客户个性化服务的数据支持,帮助企业优化营销资源分配,提高营销效率和投资回报率。1. 数据处理:对从销售记录表中采集到的数据进行脱敏、降噪、清洗、聚集、分析,确保数据质量和准确性。2. 数据加工:运用RFM模型结合客户在2024年1月1日至2024年12月31日期间的消费行为数据,从三个维度评估客户价值:-距离上一次消费的天数R ;- 客户在2024年1月1日至2024年12月31日之间的统计时间内消费频次F;- 客户在2024年1月1日至2024年12月31日之间的统计时间内消费金额M(元)。3. 评分规则:a. R值评分:将客户按最近一次消费时间距今的天数从小到大排序,分为5等份。最近消费的前20%客户获得5分,接下来的20%获得4分,以此类推。注意:R值越小,表示客户越活跃,得分越高。b. F值评分:将客户按消费频次从高到低排序,分为5等份。消费频次最高的前20%客户获得5分,接下来的20%获得4分,以此类推。c. M值评分:将客户按消费金额从高到低排序,分为5等份。消费金额最高的前20%客户获得5分,接下来的20%获得4分,以此类推。4. 综合评分计算:RFM综合得分 = 0.3*(R得分)+ 0.3*(F得分)+ 0.4*(M得分);权重分配反映了消费金额在客户价值评估中的相对重要性。5. 客户等级划分: - A级客户:RFM得分 ≥ 4分,高价值客户,需重点维护; - B级客户:3分 ≤ RFM得分 < 4分,中高价值客户,有发展潜力;- C级客户:2分 ≤ RFM得分 < 3分,中低价值客户,需激活;- D级客户:RFM得分 < 2分,低价值客户,维护成本高;6. 动态更新:模型每年更新一次,确保客户分类的时效性和准确性,支持企业及时调整客户关系管理策略。
This dataset collects data of Shangrao City from the sales record table, and adopts the RFM model to conduct value rating for customers based on three metrics: R (days since the customer's last purchase), F (purchase frequency within the statistical period), and M (total consumption amount in yuan within the statistical period), to enable precise customer operation. Through hierarchical management of customer value in Shangrao City, it meets the personalized demands of customers with different value tiers:
- Tier A customers: Conduct monthly follow-up and maintenance, provide exclusive offers and VIP services to enhance customer loyalty;
- Tier B customers: Conduct quarterly follow-up and maintenance, provide customized product recommendations to boost customer value;
- Tier C customers: Conduct semi-annual follow-up and maintenance, activate consumption potential via promotional campaigns;
- Tier D customers: Conduct annual follow-up and maintenance, assess customer churn risk and implement retention strategies.
Additionally, this model offers data support for local enterprises with highly overlapping customer bases to deliver personalized services for customers of different value types, assisting enterprises in optimizing marketing resource allocation, improving marketing efficiency and return on investment (ROI).
1. Data Processing: Anonymize, denoise, clean, aggregate and analyze the data collected from the sales record table to guarantee data quality and accuracy.
2. Data Preparation and Modeling: Apply the RFM model combined with customers' purchase behavior data from January 1, 2024 to December 31, 2024 to evaluate customer value from three dimensions:
- R: Days since the customer's last purchase;
- F: Purchase frequency within the statistical period (January 1, 2024 to December 31, 2024);
- M: Total consumption amount (yuan) within the statistical period (January 1, 2024 to December 31, 2024).
3. Scoring Rules:
a. R Score: Sort customers by the number of days since their last purchase in ascending order, and divide them into 5 equal quantiles. The top 20% of customers who made the most recent purchases receive 5 points, the next 20% receive 4 points, and so forth. Note: A smaller R value indicates a more active customer and thus a higher score.
b. F Score: Sort customers by purchase frequency in descending order, and divide them into 5 equal quantiles. The top 20% of customers with the highest purchase frequency get 5 points, the next 20% get 4 points, and so forth.
c. M Score: Sort customers by total consumption amount in descending order, and divide them into 5 equal quantiles. The top 20% of customers with the highest total consumption amount get 5 points, the next 20% get 4 points, and so forth.
4. Composite Score Calculation: RFM Composite Score = 0.3*(R Score) + 0.3*(F Score) + 0.4*(M Score); the weight allocation reflects the relative importance of consumption amount in customer value evaluation.
5. Customer Tier Classification:
- Tier A customers: RFM score ≥ 4, high-value customers requiring critical maintenance;
- Tier B customers: 3 ≤ RFM score < 4, mid-to-high value customers with development potential;
- Tier C customers: 2 ≤ RFM score < 3, mid-to-low value customers needing activation;
- Tier D customers: RFM score < 2, low-value customers with high maintenance costs;
6. Dynamic Update: The model is updated annually to ensure the timeliness and accuracy of customer segmentation, and enable enterprises to timely adjust their customer relationship management (CRM) strategies.
提供机构:
杭州心樾科技有限公司
创建时间:
2025-07-01
搜集汇总
数据集介绍
背景与挑战
背景概述
该数据集包含721条上饶市地区购买财务软件客户的RFM价值评估记录,采用R(最近消费天数)、F(消费频次)、M(消费金额)三个维度进行评分和等级划分(A/B/C/D级),每年更新一次,旨在帮助企业实现客户精准分层和优化营销策略。
以上内容由遇见数据集搜集并总结生成


