ibm-granite/ChartNet
收藏Hugging Face2026-04-30 更新2026-04-12 收录
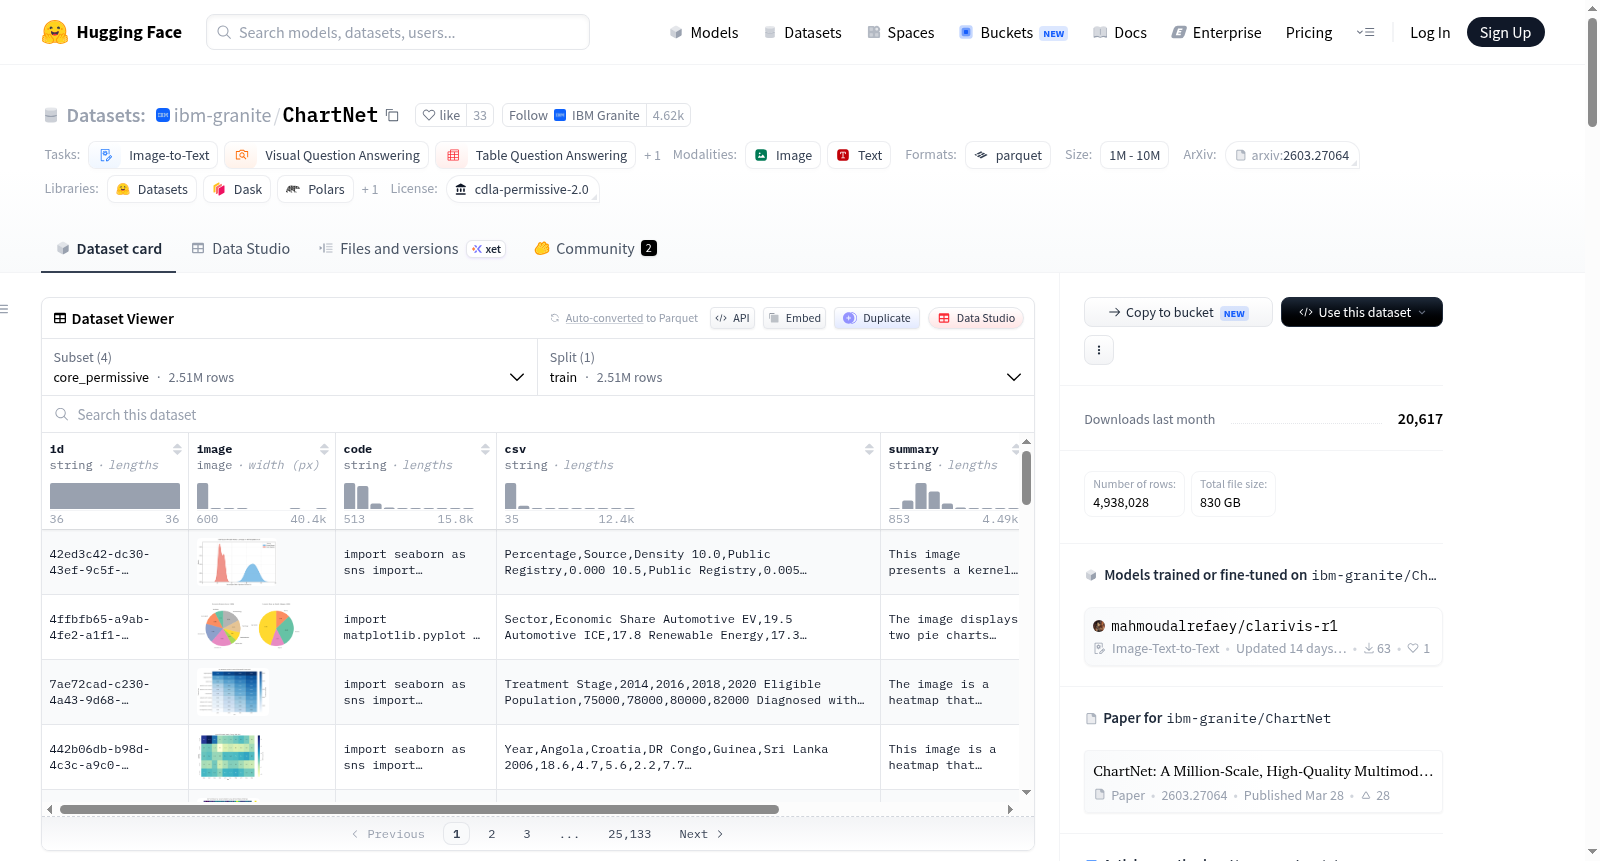
下载链接:
https://hf-mirror.com/datasets/ibm-granite/ChartNet
下载链接
链接失效反馈官方服务:
资源简介:
---
task_categories:
- image-to-text
- visual-question-answering
- table-question-answering
- text-generation
configs:
- config_name: core_permissive
data_files:
- split: train
path: core_permissive/*
default: true
- config_name: core
data_files:
- split: train
path: core/*
- config_name: reasoning
data_files:
- split: train
path: reasoning/*
- config_name: human_verified
data_files:
- split: train
path: human_verified/train/*
- split: test
path: human_verified/test/*
dataset_info:
- config_name: core_permissive
features:
- name: id
dtype: string
- name: image
dtype: image
- name: code
dtype: string
- name: csv
dtype: string
- name: summary
dtype: string
- name: chart_type
dtype: string
- name: library
dtype: string
- config_name: core
features:
- name: id
dtype: string
- name: image
dtype: image
- name: code
dtype: string
- name: csv
dtype: string
- name: summary
dtype: string
- config_name: reasoning
features:
- name: id
dtype: string
- name: image
dtype: image
- name: complex_question
dtype: string
- name: full_reasoning
dtype: string
- config_name: human_verified
features:
- name: id
dtype: string
- name: image
dtype: image
- name: code
dtype: string
- name: csv
dtype: string
- name: summary
dtype: string
license: cdla-permissive-2.0
size_categories:
- 1M<n<10M
---
# ChartNet: A Million-Scale Multimodal Dataset for Chart Understanding
🌐 [Homepage](https://huggingface.co/datasets/ibm-granite/ChartNet) | 📖 [arXiv](https://arxiv.org/abs/2603.27064)
---
## 📝 Changelog
- **April 29, 2026** — Release of an additional 2.5 million row subset `core_permissive` (subject to [cdla-permissive-2.0](https://huggingface.co/datasets/ibm-granite/ChartNet#%F0%9F%AA%AA-license-notice))
- **March 31, 2026** — Initial release of ChartNet with `core`, `reasoning`, and `human_verified` subsets (subject to [Notice Regarding Data Availability](https://huggingface.co/datasets/ibm-granite/ChartNet#%E2%84%B9%EF%B8%8F-notice-regarding-data-availability))
---
## 🗂️ Dataset Summary
Chart understanding requires models to jointly reason over geometric visual patterns, structured numerical data, and natural language descriptions—capabilities
where current VLMs still fall short. **ChartNet** addresses this gap by offering a large‑scale, high‑quality multimodal dataset designed for **robust chart interpretation and reasoning**.
The core dataset contains **1.7 million richly annotated chart samples**, each offering tightly aligned **visual**, **numerical**, and **textual** components.
All samples pass through a rigorous quality‑filtering pipeline to ensure visual fidelity, semantic correctness, and dataset diversity.
Together, these elements enable models to perform structured, interpretable, end‑to‑end reasoning directly from chart images. More details are available in our
upcoming [CVPR 2026 paper](https://arxiv.org/abs/2603.27064).
ChartNet has been used to train the *Granite Vision 4* series of models: [Granite-4.0-3B-Vision](https://huggingface.co/ibm-granite/granite-4.0-3b-vision) and [Granite-Vision-4.1-4B](https://huggingface.co/ibm-granite/granite-vision-4.1-4b).
---
## 📊 Key Statistics
- **4.2M** synthetic chart samples ([2.5M charts have permissive licensing](https://huggingface.co/datasets/ibm-granite/ChartNet/tree/main/core_permissive))
- **94,643** human‑verified chart examples
- **2,000** human‑verified test samples
- **30K** real‑world charts (coming soon)
- **24** chart types
- **6** plotting libraries
---
## 🔧 Code‑Guided Synthesis Pipeline
ChartNet is built using a **code‑guided chart synthesis pipeline** spanning **24 chart types** across **six plotting libraries**.

Starting from a small seed set of chart images, a VLM generates approximate reconstruction code. The code representation is then used to:
1. **Regenerate charts with diverse stylistic and semantic variations**
2. **Derive aligned structured attributes**, including:
- Tabular data
- Natural‑language summaries
- Question–answer pairs with detailed chain‑of‑thought reasoning
Each ChartNet example provides **four tightly aligned components**:
- Plotting code
- Rendered chart image
- Underlying data table
- Natural‑language summary
This multimodal alignment covers the full spectrum of chart comprehension tasks.
A fifth component, QA pairs with step‑by‑step reasoning, is included for 632K charts and will be available for all charts with subsequent releases.
---
## 📚 Specialized Subsets
ChartNet includes several focused subsets:
### ✅ **Human‑annotated subset** *(available now)*
A curated, high‑quality subset of **94,643** synthetic charts with human‑verified images, summaries, and tables.
Includes a **2,000‑chart** human‑verified test set.
### ✅ **Real‑world chart subset** *(coming soon - to be released by our collaborator Abaka AI)*
An annotated collection of **30K** charts from reputable media and visualization sources.
### ✅ **Safety‑focused content** *(coming soon)*
Charts and QA pairs crafted for safety alignment and jailbreak‑resistant reasoning.
### ✅ **Grounding / localization subset** *(coming soon)*
Focused on grounding and region‑aware chart comprehension and reasoning.
The current release includes only the **core dataset** and **human‑verified subset**, with additional data actively being generated.
---
## 🎯 Designed for End‑to‑End Chart Intelligence
ChartNet supports a broad range of chart understanding tasks:
- **Chart reconstruction (chart2code)**
Recover plotting code or structured chart specifications.
- **Data extraction (chart2csv)**
Retrieve underlying values and tables directly from chart visuals.
- **Chart summarization (chart2text)**
Produce concise NL summaries describing patterns and trends.
- **Reasoning and QA**
Answer semantic, relational, and quantitative questions using chain‑of‑thought reasoning.
---
## 📥 Guide on Data Loading
ChartNet supports the HuggingFace `datasets` library for downloading subsets:
```python
from datasets import load_dataset
# load the permissive use subset (subject to Community Data License Agreement – Permissive, Version 2.0)
core_permissive = load_dataset("ibm-granite/ChartNet", "core_permissive")
```
To load the releases that correspond with the paper, specify the appropriate subsets:
```python
# load the original overlapping core and reasoning subsets (they can be joined by the "id" column):
core = load_dataset("ibm-granite/ChartNet", "core")
reasoning = load_dataset("ibm-granite/ChartNet", "reasoning")
# load the original human reviewed train/test splits (they are completely disjoint from the core and reasoning subsets):
human_verified_train = load_dataset("ibm-granite/ChartNet", "human_verified", split="train")
human_verified_test = load_dataset("ibm-granite/ChartNet", "human_verified", split="test")
```
These original subsets are subject to the [Notice Regarding Data Availability](https://huggingface.co/datasets/ibm-granite/ChartNet#%E2%84%B9%EF%B8%8F-notice-regarding-data-availability).
Each subset can be several hundred gigabytes in size, so it is recommended to download individual files as needed:
```python
# load the first 10_000 entries from the core dataset (1.66GB in size):
first_core_file = load_dataset("ibm-granite/ChartNet", data_files="core/core_000.parquet")
print(first_core_file.shape) # output: {'train': (10000, 5)}
```
---
### 🪪 License Notice
**April 29, 2026 — ChartNet Licensing Update**
IBM is releasing a new default version of the ChartNet dataset following changes to its composition and generation process. Based on those changes, IBM is making this version available under the Community Data License Agreement – Permissive, Version 2.0.
For reproducibility and evaluation of the original release, access to the previously released dataset is retained via separate mechanism as described in the [Guide on Data Loading](https://huggingface.co/datasets/ibm-granite/ChartNet#%F0%9F%93%A5-guide-on-data-loading). The original release remains subject to the [Notice Regarding Data Availability](https://huggingface.co/datasets/ibm-granite/ChartNet#%E2%84%B9%EF%B8%8F-notice-regarding-data-availability) and requires users to follow the explicit retrieval steps described in its dataset card. The original release is provided solely to enable reproducibility and comparative evaluation of the original release and should NOT be used as a substitute for the current default release.
---
### ℹ️ Notice Regarding Data Availability
By downloading, accessing, or using this dataset, you acknowledge and agree to the terms and limitations set forth in this __Notice Regarding Data Availability__.
This dataset is made available solely to support the verification and evaluation of the results presented in __ChartNet: A Million-Scale, High-Quality Multimodal Dataset for Robust Chart Understanding__.
No license, covenant, or other rights are granted with respect to this dataset, either expressly or by implication. The authors do not assert intellectual property rights in this dataset and make no representations regarding ownership, provenance, or freedom to operate.
This dataset may not be used for commercial exploitation or commercial deployment. This limitation reflects the fact that the dataset was generated using outputs produced under the Mistral Research License (MRL), under which commercial use is restricted.
Portions of the dataset may be derived from, reference, or be inspired by prior publicly available datasets and other upstream sources, which may be subject to their own license terms, including but not limited to the GNU General Public License. Recipients who access or use this dataset for any purpose assume all risk and sole responsibility for determining and complying with any applicable third‑party rights, licenses, or restrictions.
THIS DATASET IS PROVIDED “AS IS,” WITHOUT WARRANTIES OF ANY KIND, EXPRESS OR IMPLIED, INCLUDING BUT NOT LIMITED TO WARRANTIES OF MERCHANTABILITY, FITNESS FOR A PARTICULAR PURPOSE, ACCURACY, OR NON‑INFRINGEMENT. IN NO EVENT SHALL THE AUTHORS OR THEIR AFFILIATES BE LIABLE FOR ANY DAMAGES ARISING FROM ACCESS TO OR USE OF THIS DATASET.
ChartNet is a large-scale, high-quality multimodal dataset designed for robust chart interpretation and reasoning. It contains 1.7 million richly annotated chart samples, each offering tightly aligned visual, numerical, and textual components. The dataset supports a broad range of chart understanding tasks, including chart reconstruction, data extraction, chart summarization, and reasoning and QA. It includes several specialized subsets such as the core dataset, reasoning subset, and human-verified subset, each with distinct features and purposes. Additionally, the dataset provides detailed loading instructions and licensing information.
提供机构:
ibm-granite
搜集汇总
数据集介绍
构建方式
ChartNet的构建依托于一种创新的代码引导式合成流水线。该方法始于一个小规模的图表图像种子集,借助视觉语言模型生成近似重构代码,进而利用代码表示实现多样化的风格与语义变体图表再生。在此过程中,同步推导出紧密对齐的结构化属性,包括表格数据、自然语言摘要以及包含详细思维链的问答对。每个样本均整合了绘图代码、渲染图像、底层数据表和文本摘要四个组件,覆盖了图表理解任务的完整谱系。
使用方法
ChartNet可通过HuggingFace datasets库便捷加载,支持按子集名称直接下载。用户可分别加载核心许可子集、核心子集、推理子集及人工验证子集的训练与测试划分。由于各子集体积可达数百吉字节,推荐按需下载单个parquet文件,例如通过指定数据文件路径仅加载前10,000条记录。该数据集适用于图表重建、数据提取、摘要生成及推理问答等多种端到端任务。
背景与挑战
背景概述
图表理解任务要求模型同步推理几何视觉模式、结构化数值数据与自然语言描述,这构成了多模态人工智能领域的核心挑战。当前视觉语言模型在此类任务中仍显不足。为应对这一缺口,IBM研究团队于2026年发布了ChartNet数据集,旨在推动稳健的图表解释与推理能力。该数据集由来自IBM Granite团队的专家构建,核心包含170万高质量图表样本,每个样本均提供紧密对齐的视觉、数值与文本组件。通过严格的质检流程确保视觉保真度、语义正确性与数据集多样性,ChartNet支持图表重建、数据提取、摘要生成及推理问答等多项任务,已成功应用于Granite Vision 4系列模型的训练,并在CVPR 2026会议上发表相关论文,对多模态图表理解领域产生了深远影响。
当前挑战
ChartNet所解决的核心领域挑战在于,现有模型难以同时处理图表中的几何视觉模式、结构化数值数据与自然语言描述,实现端到端的可解释推理。构建过程中面临的挑战包括:如何从少量种子图表出发,利用代码引导的合成管道生成覆盖24种图表类型、6种绘图库的420万样本;如何确保每个样本包含生成代码、渲染图像、数据表格与自然语言摘要的高度对齐;如何通过人类验证机制对94,643个样本进行质量把关,并在2000个测试集上保持客观评估标准。此外,数据集版本的许可证调整、原始数据可用性限制以及第三方许可合规性问题,也为数据的广泛使用带来了额外复杂性。
常用场景
经典使用场景
在图表理解这一多模态挑战中,ChartNet以其百万级规模的精细标注,成为训练视觉语言模型完成从图表图像到结构化信息的端到端推理的基石。经典使用场景包括:根据图表图像恢复出生成该图表的绘图代码(chart2code),实现图表的重构;从视觉信息中精确提取底层表格数据(chart2csv),替代传统OCR与手动解析;生成自然语言摘要(chart2text),捕捉数据的趋势与模式;以及结合思维链推理的复杂问答,回答涉及语义关系、数值比较和逻辑推理的问题。
解决学术问题
当前视觉语言模型在联合推理几何视觉模式、结构化数值与自然语言描述的能力上仍显不足,ChartNet正是为攻克这一瓶颈而生。它解决了跨模态对齐与精细推理的学术难题,通过海量合成数据与人工验证子集,提供了视觉、数值与文本紧密耦合的标注范式。这一资源使得研究者能够系统性地评估和提升模型在图表信息抽取、语义理解与因果推理上的表现,推动了多模态学习领域向更鲁棒、更可解释的图表智能迈进。
实际应用
在实际产业应用中,ChartNet赋能了从金融报告分析、科研数据可视化到商业智能仪表盘解读的自动化流程。借助该数据集训练的模型能够自动将PDF或截图中的复杂图表转化为可编辑的表格和摘要,极大提升数据分析师的工作效率。在教育领域,可用于为视障人群生成图表的口述描述;在数据新闻中,辅助快速提取图表关键指标并生成解释性文本。这些应用显著降低了图表信息的获取门槛,加速了数据驱动决策的普及。
数据集最近研究
最新研究方向
ChartNet数据集聚焦于图表理解领域的前沿研究,尤其是通过大规模多模态数据推动视觉语言模型在结构化推理上的突破。该数据集包含170万高质量图表样本,覆盖24种图表类型和6种绘图库,并采用代码引导的合成流程生成紧密对齐的视觉、数值和文本信息。ChartNet已用于训练Granite Vision 4系列模型,在图表重建、数据提取、摘要生成和问答推理等任务上展现出显著能力。其独特的推理子集和人工验证子集为评估模型在复杂逻辑链上的表现提供了坚实基准,反映了当前研究热点——将几何视觉模式与表格化结构化数据及自然语言无缝融合,以实现端到端的可解释图表理解,这对自动化数据分析、智能报告生成等应用具有里程碑意义。
以上内容由遇见数据集搜集并总结生成


