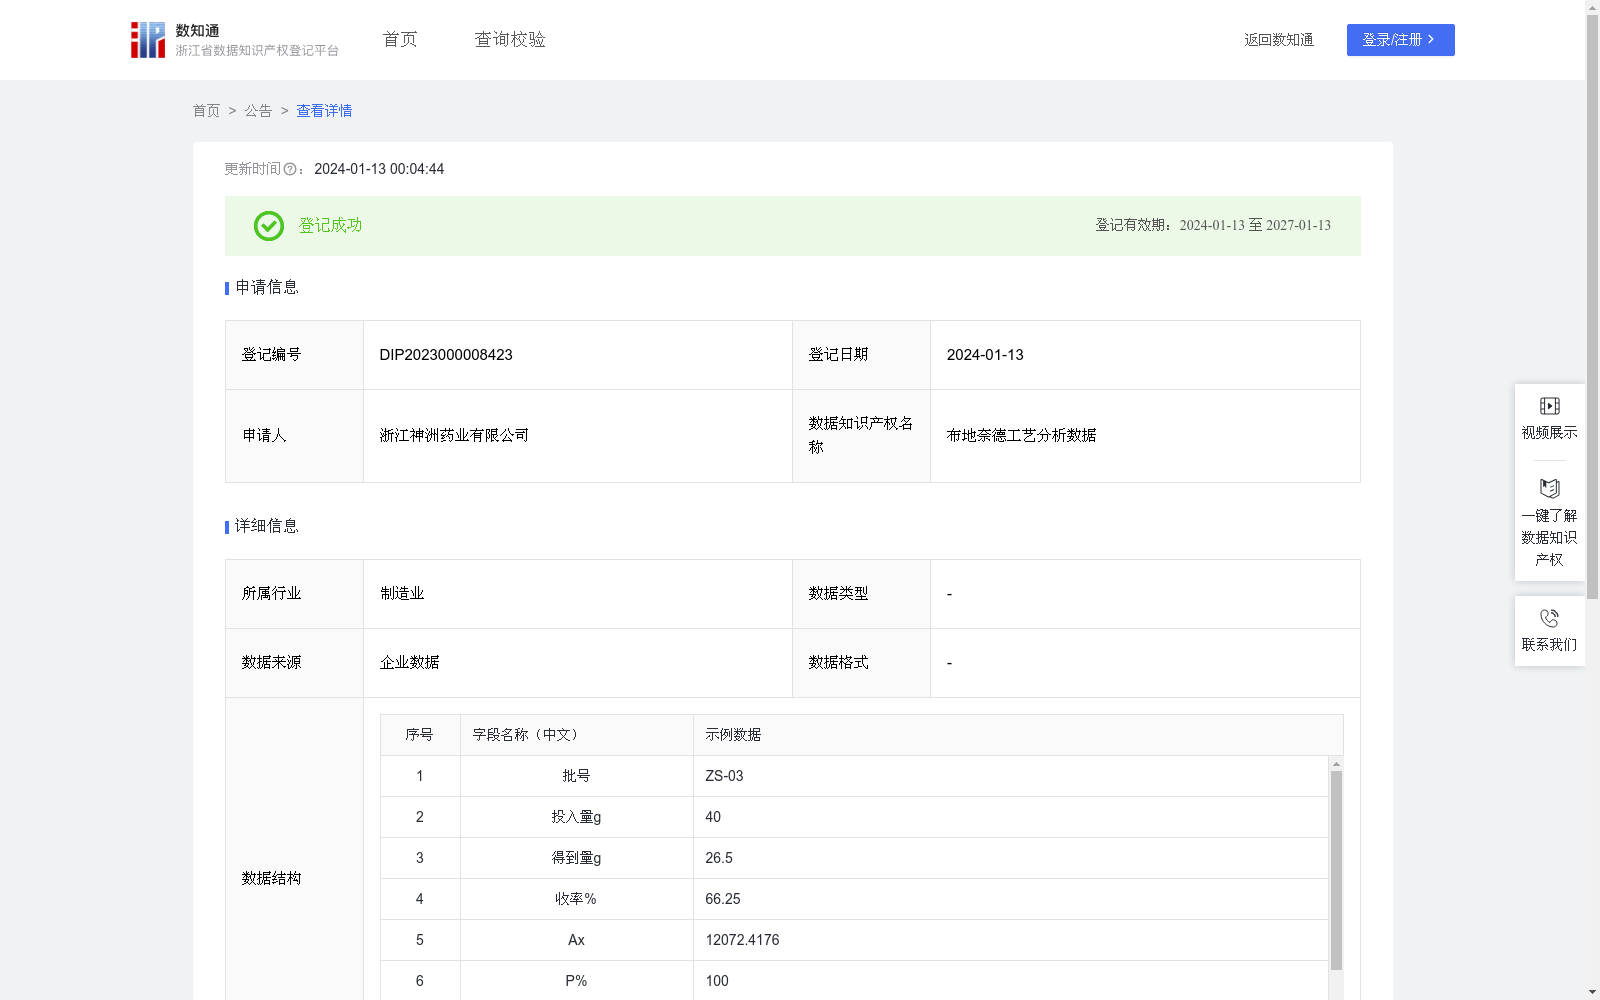
布地奈德工艺分析数据
收藏资源简介:
通过采集公司布地奈德产品在不同工艺上的投入量、得到量、AX值、P值、Mx值等计算得出收率和纯度,再以此工艺在不同反应试剂、不同反应倍数、不同反应时间和不同反应温度下计算得出的含量值和收率值。通过计算数据比对,从中筛选出纯度高、收率高的最佳路线。以此获得最佳的专利产品收率和含量(纯度),实现专利数据价值,获得了一条杂质少、收率高、成本低的产业化生产工艺。通过比对不同条件下的实验及中试放大数据来分析产品的分布收率、总收率和含量(纯度),实验室研发和中试放大试验均做了N批次的数据验证.含量(纯度)的算法有滴定法、液相法、紫外分析法等,我们采用液相的外标计算方法,该方法计算更加准确不受称压量的影响,公式:Ax*P/Mx*f*100%算出每组含量,(Mx—样品的重量,mg;Ax—在含量测试液中得到样品的峰面积;f平均—平均校正因子;P—对照品的含量)再通过数据分析选出含量高杂质少的。收率的计算:投入单位数量原料药获得的实际生产产品(投入量)与理论计算的产品产量(得到量)的比值*100%,以此算法得到计算数据去分析比对得到最佳结果。
This dataset is generated by collecting parameters including input dosage, actual output quantity, peak area (Ax), reference standard purity (P), and sample weight (Mx) of the company's Budesonide products across different production processes, followed by calculating the process yield and purity. Subsequently, content and yield values are calculated using the optimized process under varied conditions including different reaction reagents, reaction scale multiples, reaction durations, and reaction temperatures. By comparing and analyzing the calculated data, the optimal process route with high purity and high yield is screened out, so as to obtain the optimal yield and content (purity) of the patented product, realize the value of patent data, and finally develop an industrial production process with fewer impurities, high yield and low cost. We performed N batches of data verification for both laboratory R&D and pilot scale-up tests, which is conducted by comparing experimental and pilot scale-up data under different conditions to analyze product distribution yield, total yield, and content (purity). For content (purity) calculation, multiple methods are available such as titration, liquid chromatography, and ultraviolet analysis. We adopted the external standard calculation method via liquid chromatography, which boasts higher accuracy and is unaffected by sample weighing. The formula for calculating the content of each test group is: (Ax × P / Mx × f_avg) × 100%, where Mx represents the sample weight (in mg), Ax refers to the peak area of the sample in the content test solution, f_avg is the average correction factor, and P stands for the purity of the reference standard. Samples with high content and low impurities are then selected through data analysis. The calculation of yield follows the formula: (the ratio of the actual product output obtained from a unit input amount of raw materials to the theoretically calculated product output) × 100%. We use this calculation method to generate analytical data for comparison and screening to obtain the optimal results.