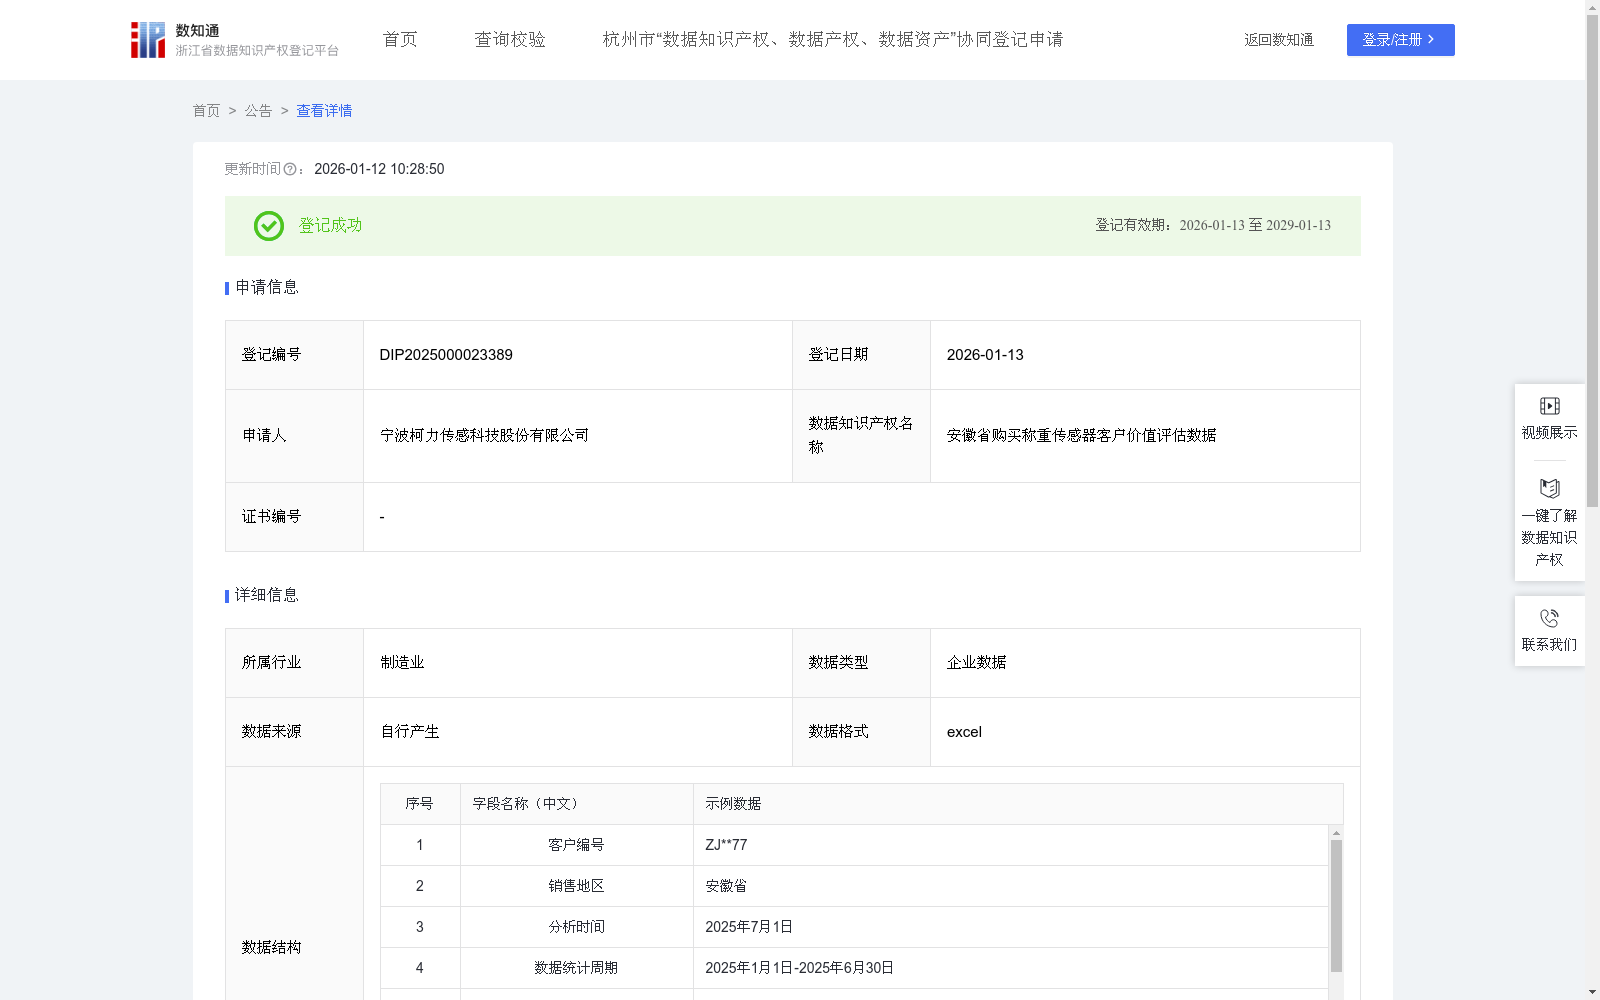
安徽省购买称重传感器客户价值评估数据
收藏浙江省数据知识产权登记平台2026-01-12 更新2026-01-13 收录
下载链接:
https://www.zjip.org.cn/home/announce/trends/8423074
下载链接
链接失效反馈官方服务:
资源简介:
本数据聚焦于安徽地区购买称重传感器的客户的价值度分级评价,揭示了不同客户群体的价值层次及其特点,为企业及外部相关方提供了重要的决策依据,具有显著的应用价值。具体体现在:
对于企业内部,可基于客户等级实施精细化运营。例如,对高价值客户配备专属技术顾问,提供定制化传感器解决方案及优先供货保障;对中价值客户推行定期回访与产品升级推荐;对潜力客户则通过自动化营销内容进行培育,有效提升资源使用效率与客户留存率。
对于同行企业,本数据可作为对标参考,通过分析高价值客户的行业分布,优化自身产品结构与发展战略,实现精准对标和差异化竞争。
对于产业链上下游企业,上游传感器元件供应商可依据本数据调整生产计划与库存策略,优先保障高价值客户对应的型号供应;下游系统集成商则可据此识别高价值合作伙伴,协同开展技术推广与售后服务,共同提升产业链协同效率和市场响应速度。1.数据采集:采集公司系统中一段周期内称重传感器类产品在安徽省的销售数据,包括客户编号、销售地区等关键字段。对相关数据进行脱敏、清洗、聚集、分析。
2.数据处理及运用:运用RFM客户价值模型结合距离最近一次购买日期的天数R(天)、购买频率F(次)、消费金额M(元)的排名得分对客户进行综合评分,得出一个RFM总评分,最终得出该客户等级。
(1)提取出客户距离最近一次购买日期的天数R(天)、购买频率F(次)和消费金额M(元)进行分类,运用IF+RANK函数计算得出距离最近一次购买日期的天数R(天)时间间隔最短的客户,按照1-5评分,排名在前20%(含)的客户5分,排名在20%-40%(含)之间的客户4分,排名在40%-60%(含)之间的客户3分;排名在60%-80%(含)之间的客户2分;排名在80%-100%(含)之间的客户1分。
(2)根据客户购买频率F(次)从高到底依次对客户进行排名分类,运用IF+RANK函数将前20%的客户在购买频率F(次)的分数评为5分,以此类推。
(3)根据客户消费金额M(元),运用IF+RANK函数将前20%的客户在消费金额M(元)的分数评为5分,以此类推。
(4)RFM总分=R评分*0.3+F评分*0.3+M评分*0.4;RFM总分≥4,客户等级为A;3≤RFM总分<4,客户等级为B;2≤RFM总分<3,客户等级为C;0<RFM总分<2,客户等级为D。
This dataset focuses on the value grading evaluation of customers who purchased load cells in Anhui Province, revealing the value hierarchy and characteristics of different customer groups, providing important decision-making basis for enterprises and external stakeholders, and has significant application value. The specific manifestations are as follows:
For internal enterprises, refined operations can be implemented based on customer grades. For example, allocate dedicated technical consultants to high-value customers, provide customized load cell solutions and priority supply guarantees; implement regular return visits and product upgrade recommendations for medium-value customers; nurture potential customers through automated marketing content, effectively improving resource utilization efficiency and customer retention rate.
For peer enterprises, this dataset can serve as a benchmarking reference. By analyzing the industry distribution of high-value customers, enterprises can optimize their own product structure and development strategy to achieve precise benchmarking and differentiated competition.
For upstream and downstream enterprises in the industrial chain: upstream load cell component suppliers can adjust production plans and inventory strategies based on this dataset, prioritizing the supply of models corresponding to high-value customers; downstream system integrators can identify high-value partners, collaborate on technology promotion and after-sales service, and jointly improve the collaborative efficiency of the industrial chain and market response speed.
1. Data Collection: Collect sales data of load cell products in Anhui Province within a specific period from the company's system, including key fields such as customer ID and sales region. Perform desensitization, cleaning, aggregation and analysis on the relevant data.
2. Data Processing and Application: Use the RFM customer value model combined with the ranking scores of three indicators: R (days, the number of days since the customer's most recent purchase), F (times, purchase frequency), and M (yuan, consumption amount) to conduct a comprehensive scoring of customers, obtain an overall RFM score, and finally determine the customer grade.
(1) Extract the three indicators of R (days), F (times) and M (yuan) for classification, use the IF+RANK function to calculate customers with the shortest time interval of R (days) since the most recent purchase, score them from 1 to 5: customers in the top 20% (inclusive) get 5 points, those between 20%-40% (inclusive) get 4 points, those between 40%-60% (inclusive) get 3 points, those between 60%-80% (inclusive) get 2 points, and those between 80%-100% (inclusive) get 1 point.
(2) Rank customers according to their purchase frequency F (times) from high to low, use the IF+RANK function to give 5 points to the top 20% of customers in terms of purchase frequency F, and so on.
(3) For the customer consumption amount M (yuan), use the IF+RANK function to give 5 points to the top 20% of customers in terms of consumption amount M, and so on.
(4) Total RFM score = R score * 0.3 + F score * 0.3 + M score * 0.4; Customer grade is A when total RFM score ≥ 4; B when 3 ≤ total RFM score < 4; C when 2 ≤ total RFM score < 3; D when 0 < total RFM score < 2.
提供机构:
宁波柯力传感科技股份有限公司
创建时间:
2025-09-28
搜集汇总
数据集介绍
背景与挑战
背景概述
该数据集基于RFM模型对安徽省购买称重传感器的客户进行价值评估,包含1089条记录,每半年更新一次。它通过分析客户的最近购买时间、购买频率和消费金额,计算出RFM总分并划分客户等级(A到D),旨在为企业提供客户精细化运营、同行对标和产业链协同的决策依据。
以上内容由遇见数据集搜集并总结生成


