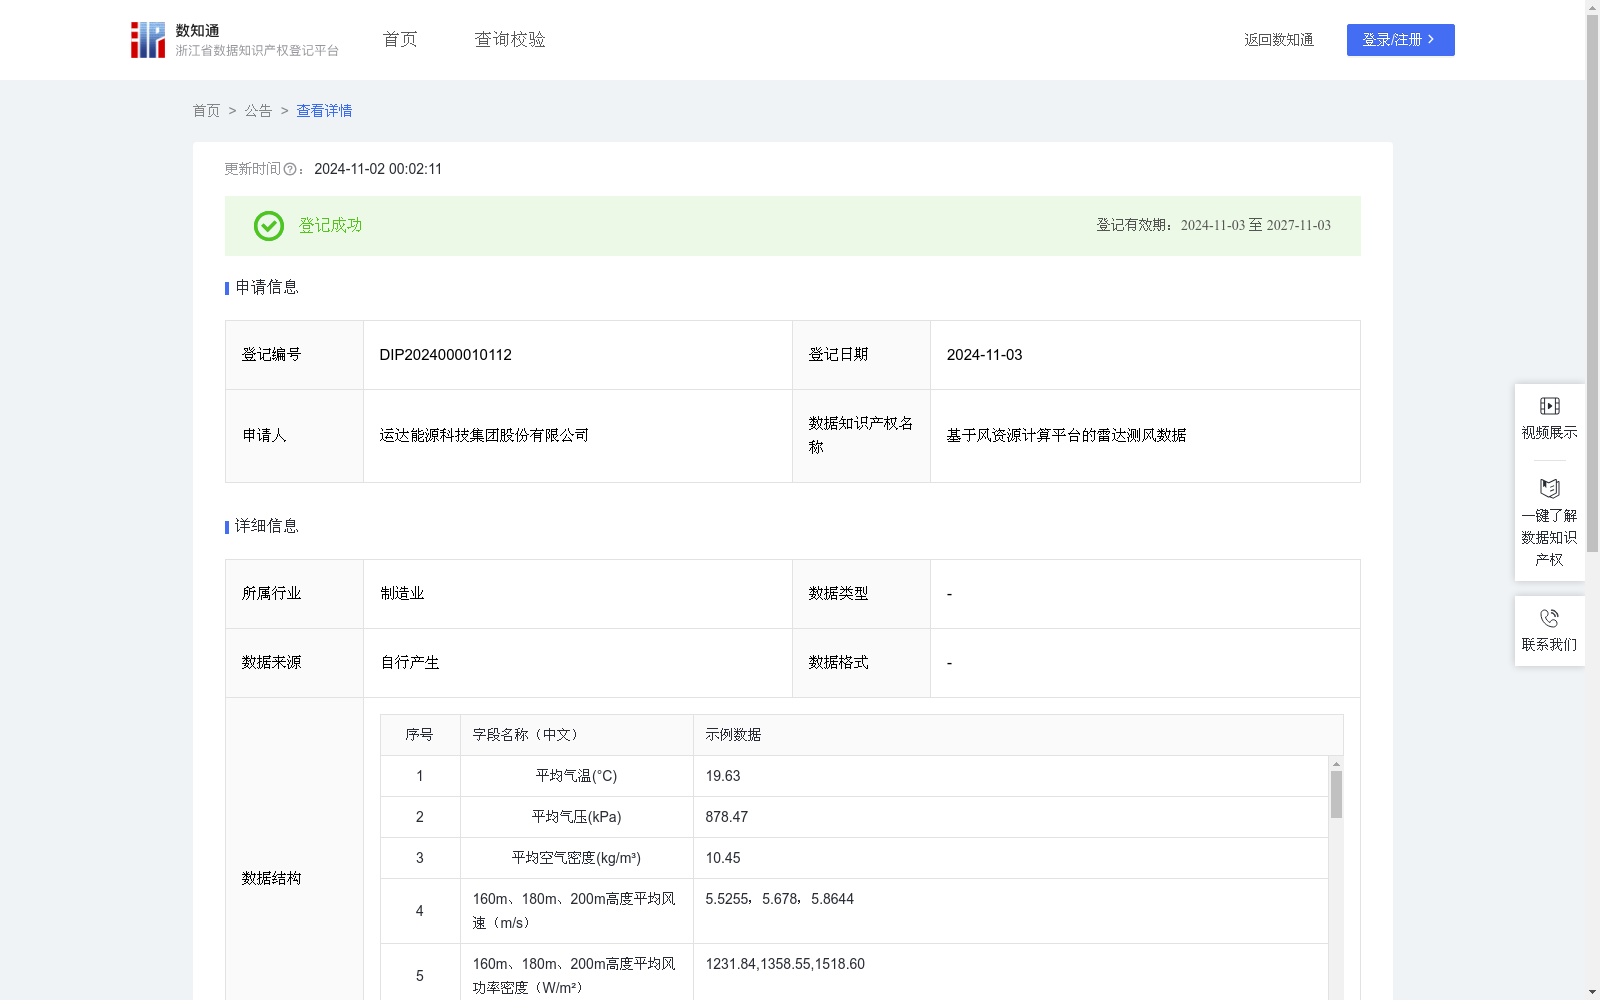
基于风资源计算平台的雷达测风数据
收藏浙江省数据知识产权登记平台2024-11-02 更新2024-11-02 收录
下载链接:
https://www.zjip.org.cn/home/announce/trends/80238
下载链接
链接失效反馈官方服务:
资源简介:
作为业内通用风资源评估软件(WT\WAsP\WindPro等)的基本输入资料之一,仿真评估风电场内风能资源参数水平及产能、经济效益水平以用于风电场开发、投资、后期运维、技术改造。现行风电项目开发投资所关注的高空、超高空(160m、180m、200m)下的测风年平均风速、平均气温、平均气压、密度、平均风功率密度值及威布尔分布参数(K\C值)、拟合切变系数、平均湍流强度。收集Lidar测风雷达10min原始数据,首先根据标准处理规范对于不合理数据(风速或风向、风速标准差等)、异常数据进行清洗剔除,保留测风时间段内的有效数据,然后采用分扇区/MCP等相关插补方法补全代表年测风数据,然后根据完整数据通过加权平均的方法计算Lidar测风雷达年平均风速、平均气温、平均气压、平均空气密度以及利用极大似然法拟合威布尔K,C参数(如统计的160m、180m、200m高度)。根据测风雷达实测气温、气压,由气象公式计算空气密度值并,根据0.5*空气密度*风速的三次方计算得到各高度层风功率密度。按照16风向扇区统计分析测风雷达主导风向为SSE。根据测风雷达不同高度层同期有效数据,拟合垂直方向风切变指数为0.331。湍流强度计算方式为每个10min时刻的风速标准偏差(SD值)除以风速每个10min时刻的平均风速值,基于10min有效数据(数据筛洗后)线性内插统计Lidar测风雷达实测高度的15m/s下平均湍流强度。数据有效率为根据测风时间段内有效数据个数/实际应测个数(10min为间隔)。
As one of the basic input datasets for industry-standard wind resource assessment software such as WT, WAsP, WindPro, this dataset is used to simulate and evaluate wind energy resource parameters, power generation capacity and economic benefits of wind farms, supporting wind farm development, investment, post-operation maintenance and technical retrofitting.
Key metrics concerned by current wind power project development and investment include annual average wind speed, average air temperature, average atmospheric pressure, air density, average wind power density, Weibull distribution parameters (K and C values), fitted wind shear exponent and average turbulence intensity at high and ultra-high altitudes (160m, 180m, 200m).
Raw 10-minute data from LiDAR wind lidars is collected first. Irrelevant and abnormal data (such as wind speed, wind direction, wind speed standard deviation and others) is removed according to standard processing specifications, retaining valid data within the measurement period. Then, representative annual wind measurement data is supplemented using sector-based/MCP and other related interpolation methods.
Next, weighted averaging is applied to the complete dataset to calculate the annual average wind speed, average air temperature, average atmospheric pressure and average air density of the LiDAR wind lidar, while the maximum likelihood estimation method is used to fit the Weibull K and C parameters (e.g., for the 160m, 180m and 200m statistical altitudes). Air density is calculated using meteorological formulas based on the measured air temperature and atmospheric pressure from the wind lidar, and wind power density at each altitude layer is derived via the formula 0.5 * air density * wind speed^3.
Statistical analysis based on 16 wind direction sectors shows that the dominant wind direction of the wind lidar is SSE. Based on the simultaneous valid data from different altitude layers of the wind lidar, the vertical wind shear exponent is fitted to 0.331.
Turbulence intensity is calculated as the wind speed standard deviation (SD value) at each 10-minute interval divided by the average wind speed at that 10-minute interval. Based on the cleaned 10-minute valid data, linear interpolation is used to statistically calculate the average turbulence intensity at 15m/s for the measured altitude of the LiDAR wind lidar.
The data validity rate is calculated as the number of valid data points within the measurement period divided by the total number of expected data points (with a 10-minute interval).
提供机构:
运达能源科技集团股份有限公司
创建时间:
2024-09-26
搜集汇总
数据集介绍
以上内容由遇见数据集搜集并总结生成


