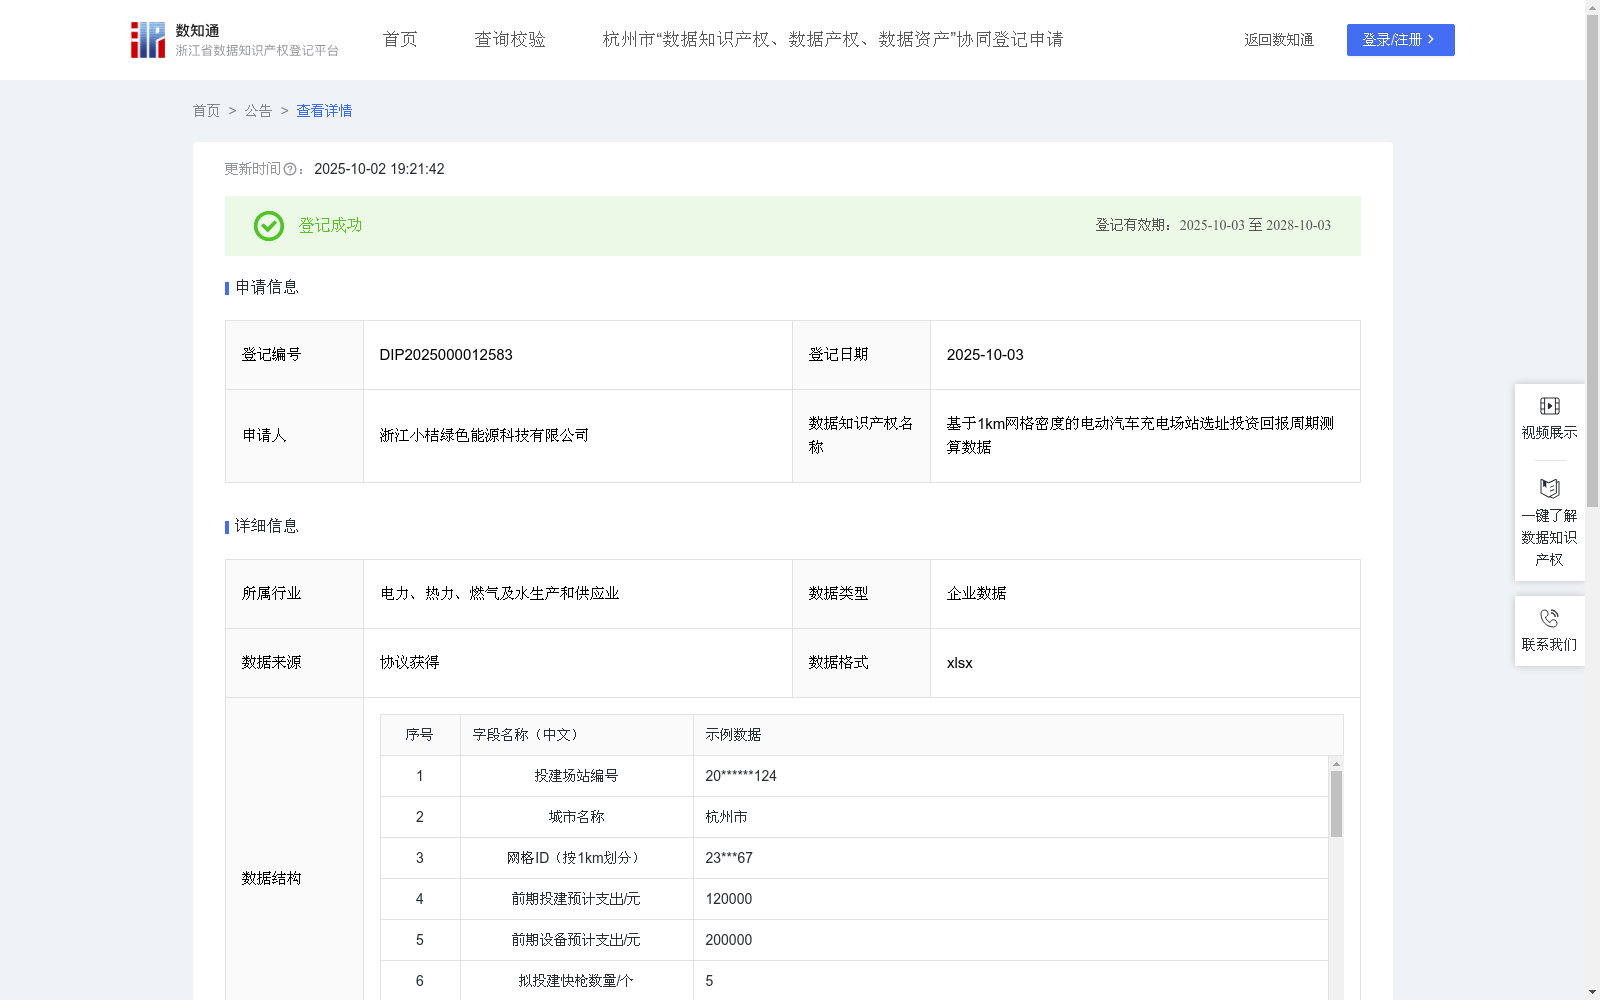
基于1km网格密度的电动汽车充电场站选址投资回报周期测算数据
收藏资源简介:
本数据集以1km网格为最小选址颗粒度,结合场站密度、单枪效率、补贴强度等要素,模拟站点投资回报周期。具体应用场景如下: 1.对平台(即申请人)而言:可在核心城区实现高密度建站的可行性测试,指导热点区域的站位微调与边际优化; 2.对场站商家而言:可获取街区级投资回报指标,对应周边建成设施与租金水平,提升建站落点决策的精度; 3.对政府而言:可基于街区级颗粒度的投资回收特征分析,识别基础设施效益低下或供需失衡的微区单元,辅助精准调配建设资源,推动充电设施建设由粗放布局向精细化落地转型。1.数据采集:原始数据经授权合法获取,包括拟投建场站编号、城市名称、网格ID(按1公里网格划分并编号)、前期投建预计支出、前期设备预计支出、拟投建快枪数量、拟投建慢枪数量、拟投建车位数、网格内直连充电站快枪月均单枪度数、网格内直连充电站快枪服务费月均单价、网格内直连充电站慢枪月均单枪度数、网格内直连充电站慢枪服务费月均单价、网格内直连充电站单站月均其他收入、网格内直连充电站单站月均运营支出、度均补贴单价预估值、车位月租金预估值、建站补贴预估值等字段。 2.构建投资收益测算模型:(1)前期预计净支出=前期投建预计支出+前期设备预计支出;(2)月均服务费收入预测值=网格内直连充电站快枪月均单枪度数*网格内直连充电站快枪服务费月均单价*拟投建快枪数量+网格内直连充电站慢枪月均单枪度数*网格内直连充电站慢枪服务费月均单价*拟投建慢枪数量;(3)月均运营补贴预测值=(网格内直连充电站快枪月均单枪度数*拟投建快枪数量+网格内直连充电站慢枪月均单枪度数*拟投建慢枪数量)*度均补贴单价预估值;(4)月均场地租金预测值=拟投建车位数*车位月租金预估值;(5)月均净收入预测值(不含建站补贴时)=月均服务费收入预测值+网格内直连充电站单站月均其他收入+月均运营补贴预测值-月均场地租金预测值-网格内直连充电站单站月均运营支出;(6)投资收益测算:当N的值满足N≥(前期预计净支出-建站补贴预估值)/月均净收入预测值(不含建站补贴时)时,N即为投资回报周期。
This dataset takes 1km grids as the minimum site selection granularity, and simulates the payback period of charging stations by combining factors such as station density, single charger efficiency, and subsidy intensity. The specific application scenarios are as follows: 1. For platforms (i.e., applicants): it enables feasibility testing of high-density station construction in core urban areas, and guides fine-tuning and marginal optimization of station locations in hotspots; 2. For station operators: it provides block-level investment return indicators, which correspond to the surrounding completed facilities and rental levels, improving the accuracy of station location decision-making; 3. For governments: based on the analysis of investment payback characteristics at block-level granularity, it can identify micro-regions with low infrastructure efficiency or unbalanced supply and demand, assist in the accurate allocation of construction resources, and promote the transformation of charging facility construction from extensive layout to refined implementation. 1. Data Collection: The raw data is legally obtained with authorization, including fields such as planned station ID, city name, grid ID (divided and numbered according to 1km grids), estimated pre-construction expenditure, estimated pre-equipment expenditure, number of planned fast chargers, number of planned slow chargers, number of planned parking spaces, monthly average charging volume per fast charger of on-grid direct-connected charging stations, monthly average charging volume per slow charger of on-grid direct-connected charging stations, monthly average service fee per fast charger of on-grid direct-connected charging stations, monthly average service fee per slow charger of on-grid direct-connected charging stations, monthly average other revenue per station of on-grid direct-connected charging stations, monthly average operating expenditure per station of on-grid direct-connected charging stations, estimated subsidy price per kilowatt-hour, estimated monthly parking space rental fee, and estimated station construction subsidy. 2. Construction of Investment Return Calculation Model: (1) Estimated Preliminary Net Expenditure = Estimated Pre-construction Expenditure + Estimated Pre-equipment Expenditure; (2) Monthly Average Service Revenue Forecast = (Monthly Average Charging Volume per Fast Charger of On-grid Direct-connected Charging Stations * Monthly Average Fast Charger Service Fee of On-grid Direct-connected Charging Stations * Number of Planned Fast Chargers) + (Monthly Average Charging Volume per Slow Charger of On-grid Direct-connected Charging Stations * Monthly Average Slow Charger Service Fee of On-grid Direct-connected Charging Stations * Number of Planned Slow Chargers); (3) Monthly Average Operating Subsidy Forecast = (Monthly Average Charging Volume per Fast Charger of On-grid Direct-connected Charging Stations * Number of Planned Fast Chargers + Monthly Average Charging Volume per Slow Charger of On-grid Direct-connected Charging Stations * Number of Planned Slow Chargers) * Estimated Subsidy Price per Kilowatt-hour; (4) Monthly Average Site Rental Forecast = Number of Planned Parking Spaces * Estimated Monthly Parking Space Rental Fee; (5) Monthly Average Net Revenue Forecast (excluding station construction subsidy) = Monthly Average Service Revenue Forecast + Monthly Average Other Revenue per Station of On-grid Direct-connected Charging Stations + Monthly Average Operating Subsidy Forecast - Monthly Average Site Rental Forecast - Monthly Average Operating Expenditure per Station of On-grid Direct-connected Charging Stations; (6) Investment Return Calculation: When N satisfies N ≥ (Estimated Preliminary Net Expenditure - Estimated Station Construction Subsidy) / Monthly Average Net Revenue Forecast (excluding station construction subsidy), N is the investment payback period.